App Holes Explain Why Fitment Data Never Stays Clean

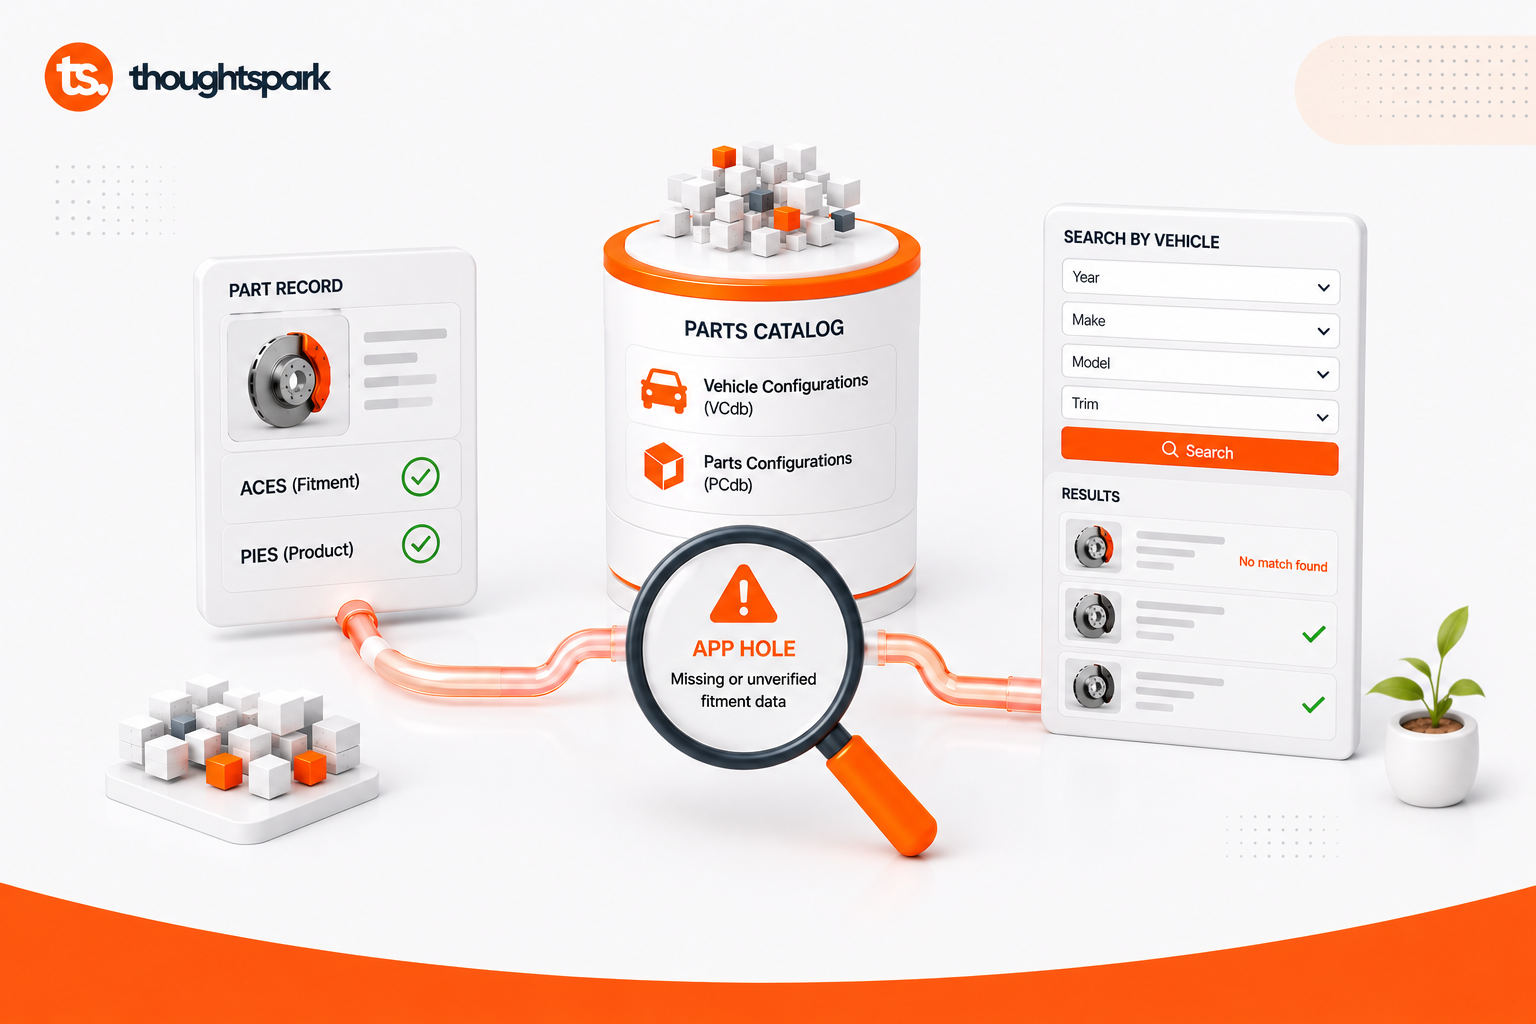
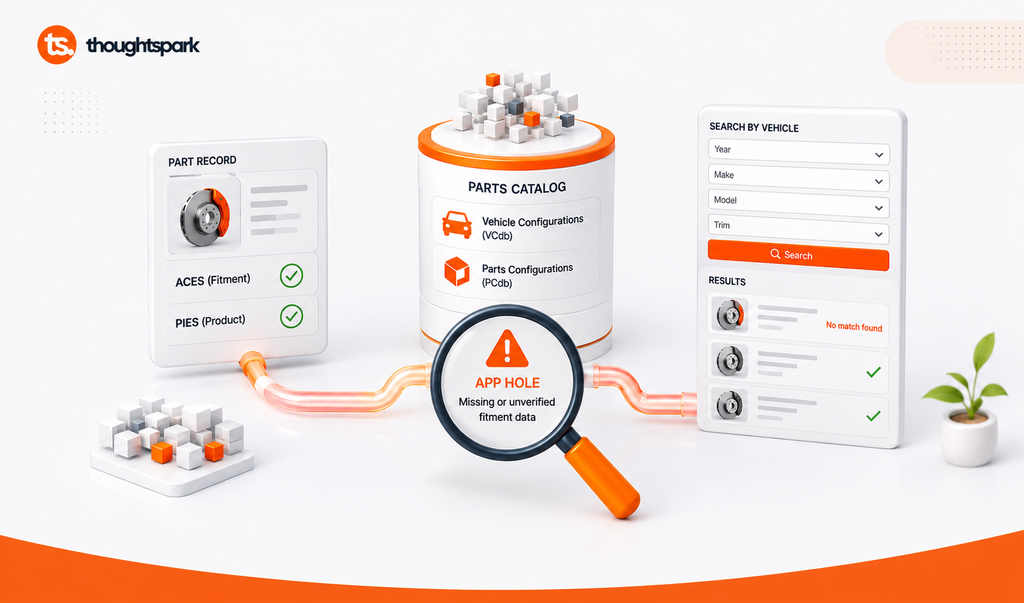
A 3D illustration showing a part record with ACES and PIES fitment checks both passed, connected through a magnifying glass labeled App Hole to a vehicle search panel showing one result marked No Match Found, representing a gap in automotive aftermarket fitment data.

A customer searches your online catalog for their exact make, model, and year, looking for a part they already know exists. The listing itself looks complete everywhere else, price, description, photos. The one detail that actually decides whether the search returns a result, whether it fits their specific vehicle, was never entered.

The industry has a name for this gap: an app hole. What’s less obvious is why it exists on a catalog that passed a full fitment audit only months earlier.

The audit was accurate on the day it ran. What has changed since follows a specific, traceable pattern, and tracing exactly what moved is the difference between fixing this once and watching it come back.


In brief

  • An app hole is missing or unverified vehicle fitment data attached to a part, industry shorthand for a gap that makes a part invisible to a customer’s search
  • A catalog fully mapped at launch accumulates app holes as new parts, vehicle configurations, and supplier updates move faster than anyone is tracking them
  • Two separate standards govern this data, ACES for fitment, PIES for the product itself, and a part can pass one while failing the other
  • Closing this gap requires an ongoing owner for the update path, not a one-time cleanup or better software alone

An app hole, in this context, refers to a gap in vehicle fitment data, a part listed for sale with no verified match to the vehicles it should fit, using the Aftermarket Catalog Exchange Standard’s own terminology for the failure.


What an App Hole Actually Is

What is an app hole in automotive aftermarket data? An app hole is a gap in vehicle fitment data, a part listed for sale without a verified connection to the vehicles it actually fits. The term comes directly from the industry’s own data standard, not from a vendor or a consultant coining a phrase.

Fitment itself is governed by ACES, the Aftermarket Catalog Exchange Standard, maintained by the Auto Care Association. ACES structures exactly which part matches which vehicle, by year, make, model, engine, transmission, and additional qualifiers, so that every trading partner in the industry, manufacturer, distributor, retailer, marketplace, reads fitment the same way, machine to machine, without manual interpretation on either end.

That structure depends on shared reference data, not just a shared format. Two databases carry the actual weight. The Vehicle Configuration Database, VCdb, holds the master record of every vehicle configuration recognized by the industry, year, make, model, and every meaningful sub-variant. The Parts Configuration Database, PCdb, holds the corresponding structure for parts themselves. An app hole exists specifically at the point where a part in a catalog has no corresponding entry connecting it to a vehicle configuration in the VCdb, even though that vehicle configuration exists and is correctly defined elsewhere in the standard.

How an App Hole Is Different From a Data Entry Mistake

A typo is wrong data, present but incorrect. An app hole is absent data, no fitment record exists at all for that part-to-vehicle pairing, which means there is nothing for a search engine, a marketplace algorithm, or a customer-facing filter to match against. The part disappears from the search result entirely, rather than ranking lower within it.

Why “Missing” Is the Wrong Word for It

Calling this “missing data” undersells how checkable the failure actually is. It is a specific, verifiable fact, one a customer can test in seconds by searching their own vehicle and getting no result, and one a business can test systematically by running its full catalog against the current VCdb and counting exactly how many app holes exist right now. That precision is what separates this from most abstract data quality language. There is no interpretation required to know whether the gap exists.


Why a Complete Catalog Doesn’t Stay Complete

A catalog that passes a fitment audit on launch day is clean for exactly one moment, that specific day, against that specific set of vehicles, suppliers, and part numbers, all of which keep changing after the audit ends.

This is the same mechanism already true of any structured catalog. Data built to be correct at one moment does not stay correct as the conditions around it shift, unless something is actively maintaining it. A closer look at AI-ready product datatraces this exact pattern in a different setting, a record accurate in January quietly going stale by June, with nothing announcing the failure. Automotive aftermarket data follows the identical pattern, just with a more concrete, more immediately visible consequence, since the VCdb and PCdb themselves are living, industry-maintained references, updated on a schedule no single catalog owner controls.

What Actually Changes Underneath a Live Catalog

Three things move constantly, independent of whether anyone updates the catalog to match. New vehicle model years release annually, sometimes with mid-year trim or configuration changes. Suppliers revise part specifications without always notifying every downstream partner. New parts get added to a catalog faster than fitment data gets verified for them. Each of these, on its own, creates one small gap. Stacked across a full catalog, they explain why app holes accumulate steadily rather than appearing all at once.


Where Fitment Data Breaks First

Where does fitment data actually break down first in a live catalog? It breaks at three specific, recurring points, not randomly across the catalog. New part onboarding, vehicle configuration updates, and supplier feed changes account for nearly all app holes that accumulate after a catalog’s initial audit.

The most common point of failure is a timing gap, a new part enters the catalog before its complete fitment mapping is ready, and the listing goes live anyway because waiting costs sales.

New Part Onboarding

A part gets added to the catalog to capture a sales opportunity, with fitment data planned as a fast follow. The follow-up frequently slips past its schedule, and the part stays live with an incomplete or absent fitment field. This is the single most common origin point for a new app hole, since it happens at the exact moment commercial pressure to publish is highest and data completeness pressure is lowest.

The gap is rarely permanent by intention. A merchandiser adds the part, expecting fitment data to follow from a supplier feed or a manual mapping pass within days. Without a specific owner tracking that follow-up, “within days” becomes “whenever someone notices,” and the part sits live and unsearchable in the meantime.

Vehicle Configuration Updates

A new model year or trim configuration is released, entering the VCdb as a new, valid entry. Until someone maps existing parts against that new configuration, every part that should fit it shows no match, an app hole that exists purely because the vehicle side of the equation changed, not the part itself.

This category is distinct from the other two in one important way: the part’s own fitment data has simply become incomplete relative to a vehicle that did not exist when the mapping was last done. A catalog can be internally consistent and still generate new app holes every time the industry’s own vehicle database expands, which happens on a predictable, recurring schedule tied to model year releases.

Supplier Feed Changes

A supplier updates a part specification on their end, a trim revision, a discontinued application, a corrected fitment range. If that update does not propagate into the receiving catalog automatically, the fitment data on file becomes silently inaccurate, still present, just no longer correct.

This is the hardest of the three to catch, since the record stays populated with data that was once accurate but no longer is. A search still returns a result. The result is simply wrong, which means the failure surfaces downstream, as a return, a complaint, or a mismatched shipment, rather than at the point where it actually occurred.


The Second Gap: When PIES Data Fails Even After ACES Passes

Can a part pass fitment validation and still fail to sell? Yes, and this is the specific failure most catalog audits never catch, because ACES and PIES are checked as two separate compliance exercises rather than one connected requirement.

A complete, accurate ACES fitment mapping does not guarantee a part is ready for sale. It can still fail the customer because the PIES side of its record, the actual product information, is incomplete.

PIES governs everything about the product itself, descriptions, attributes, pricing, packaging, digital assets, and compliance detail like hazardous material information. A part with perfect fitment data but a missing product image, an incomplete description, or an absent compliance attribute still fails to convert, or worse, gets rejected outright by a retailer’s or marketplace’s ingestion requirements.

Why This Compounding Failure Gets Missed

Most catalog audits check ACES and PIES separately, if they check both at all. A part that clears fitment validation often gets treated as done, with nobody circling back to confirm the product data side is equally complete.

The Two Standards Were Built to Work Together, Not Checked That Way

ACES and PIES describe the same part from two different angles, one answers whether it fits, the other answers what it actually is. A part record is only genuinely complete when both are true at once. Most catalog management workflows route ACES validation and PIES validation through entirely separate teams anyway, with no single checkpoint confirming both passed for the same part on the same day.

A part can look fully ready in one system and quietly unsellable in the other. The cause is structural, two disconnected checkpoints, not a lapse by either team.


Why This Problem Keeps Returning

A cleanup project fixes every app hole that exists on the day it runs. New app holes begin accumulating the day after, from the next part added, the next vehicle configuration released, the next supplier update that does not propagate.

Treating this as a project with an end date guarantees the same gap returns, on a predictable schedule tied to how fast the catalog and the vehicle market both keep moving.

What a Maintained Catalog Actually Requires

Closing this gap for good requires three things working together, not a single fix. A named owner accountable for fitment completeness on every new part, not just at initial catalog load. A recurring check against updated vehicle configuration data, not a one-time audit treated as permanent. A feedback path from supplier updates directly into the catalog, so a specification change on their end reaches the fitment record without depending on someone remembering to update it by hand.


Is Your Catalog Accumulating App Holes Right Now? A Quick Self-Assessment

Six honest questions reveal whether your catalog’s fitment data is actively maintained or quietly accumulating gaps.

Fitment and Ownership

  • Does every new part launch with complete fitment data, or does fitment data get added as a follow-up step?
  • Is there one person accountable for updating fitment mappings when a new vehicle configuration releases?
  • Would you know today how many app holes currently exist in your live catalog?

Process and Propagation

  • When a supplier updates a part specification, does that change reach your fitment data automatically?
  • Do you check ACES and PIES completeness together, or are they audited separately, if at all?
  • If a customer searched their exact vehicle right now, how confident are you every eligible part would actually appear?

Outcome guide: Three or more “no” answers means your catalog is very likely accumulating app holes faster than anyone is catching them, and the gap is probably larger than what shows up in your last audit.


What Actually Closes the Gap

Day one and day ninety are two different questions, and a clean catalog only answers the first one. The organizations that keep app holes from reaccumulating treat fitment and product data completeness as a standing operational responsibility, not a project with a finish line.

That distinction, an owned, maintained update path instead of a periodic cleanup, is the same principle behind readiness in any structured catalog, just made concrete here in a way a customer can verify with a single search.


Key Takeaways

  • An app hole is missing or unverified vehicle fitment data, industry shorthand for a gap that makes a part invisible to a customer’s search
  • A catalog fully mapped at launch accumulates app holes as new parts, vehicle configurations, and supplier updates continue after the audit ends
  • ACES governs fitment, PIES governs the product itself, and a part can pass one standard while failing the other
  • Most catalog audits check ACES and PIES separately, which is exactly how the compounding failure gets missed
  • Closing this gap requires a named owner, a recurring update check, and a direct feedback path from supplier changes, not a one-time cleanup
Reconciliation Cost Is an Ownership Problem, Not a Data Problem

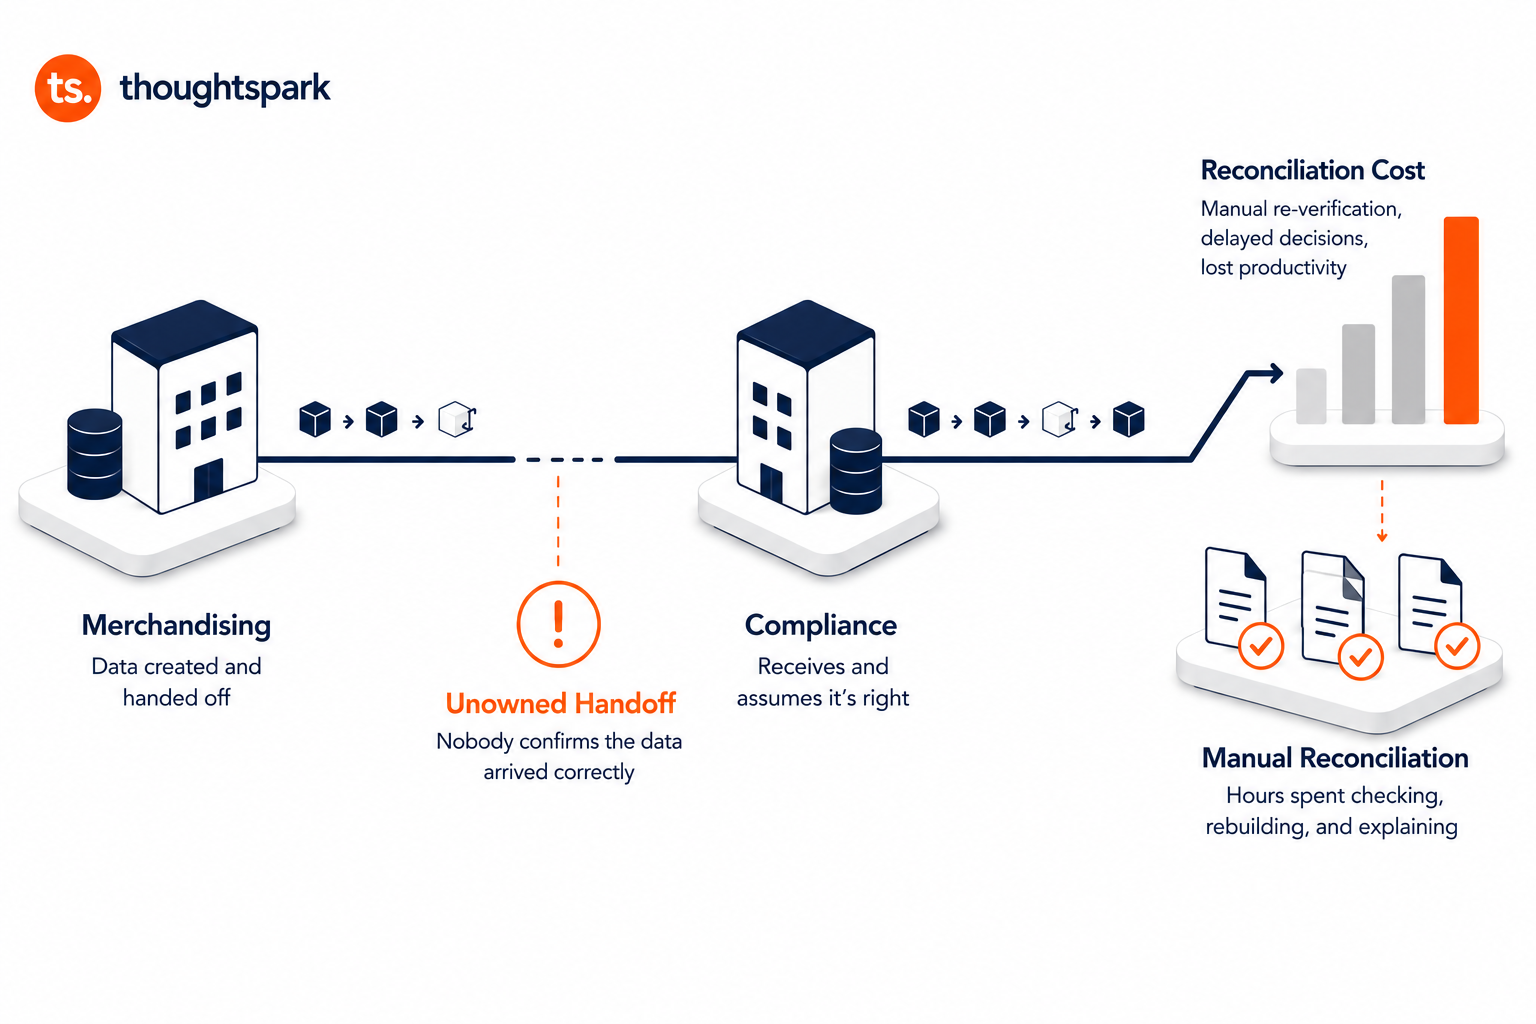
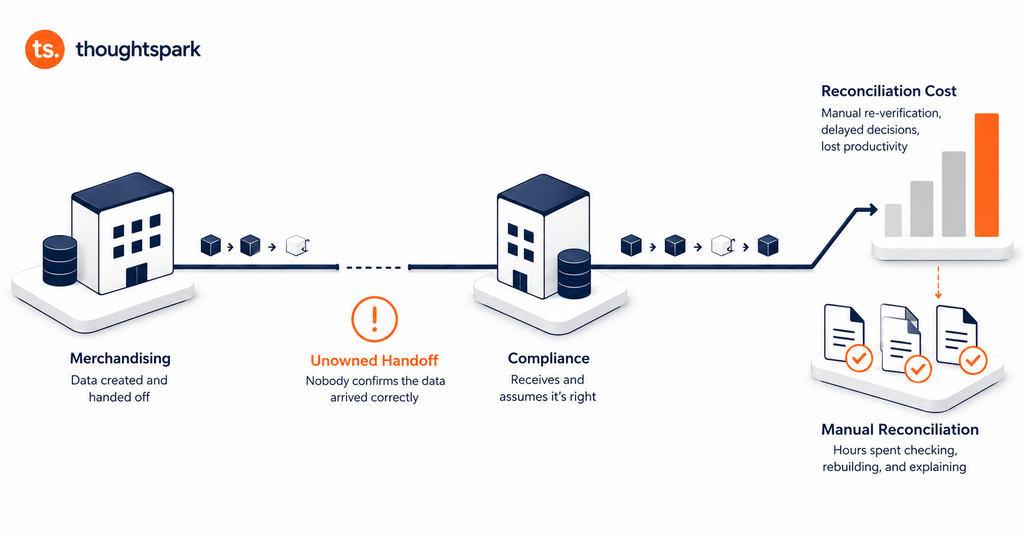
A flat vector diagram showing a Merchandising department handing off data to a Compliance department across an unowned handoff gap, feeding into a reconciliation cost bar chart and a stack of manually re-verified documents.

Reconciliation cost shows up as a line item finance already tracks, hours spent re-verifying data nobody trusts. What rarely gets tracked is where that distrust actually comes from.

It comes from one specific place. A handoff between two departments where nobody is accountable for confirming the data arrived correctly. Not a data category. Not a vague governance gap. One specific, nameable moment where responsibility passes from one team to another with no one owning the transfer itself.

That single fact changes how this cost should be read. A labor problem invites more hands. A structural gap invites a different question entirely: who was supposed to own this moment, and what happened when nobody did.


In brief

  • Reconciliation cost, the labor spent manually re-verifying data nobody trusts, has a specific, traceable root cause: the unowned handoff between departments
  • Nobody owning the confirmation that a handoff happened correctly forces the receiving team to check everything themselves
  • IBM’s research confirms distorted decision-making and eroded stakeholder trust as two of the direct consequences of poor data quality, both of which trace back to exactly this kind of unmanaged transfer point
  • Closing the ownership gap at the handoff does not just fix accountability. It directly reduces the cost line item finance already tracks

Reconciliation cost, in this context, refers to the labor an organization spends manually re-verifying data it no longer trusts, a category most finance teams already log without realizing its root cause traces back to a single, specific organizational gap.


What Reconciliation Cost Actually Measures

Reconciliation cost is manual labor spent re-verifying data nobody trusts. A team spends real, billable hours cross-checking two systems that disagree, or rebuilding a report because the automated version cannot be relied on.

That definition explains what the cost looks like. It never explains why the trust disappeared in the first place. Data does not become untrustworthy on its own. Something specific happens upstream that makes a team stop believing what a system tells them.

IBM’s own analysis of data quality names erosion of trust among stakeholders as one of four distinct consequences of poor data, alongside distorted decision-making, automated amplification, and compliance risk. Trust erosion is not an abstract cultural symptom in that framing. It has a specific mechanism, and that mechanism is what this piece traces.

Where the Trust Actually Breaks

Trust breaks at a specific point, not a general one: the handoff, the exact moment data transfers from one department to another. Ownership assigned to a title survives inside a single department. It fails at the transfer point itself, because nobody is ever assigned to the moment of handoff, only to the categories sitting on either side of it. ThoughtSpark’s own reporting on cross-functional data ownership traces this exact gap in detail, the specific mechanism by which a named owner still leaves the transfer point uncovered.

That gap is where reconciliation cost actually originates.


Why Unowned Handoffs Produce Exactly This Cost

Follow the logic one step at a time, since each step is a direct consequence of the one before it.

A handoff has no named owner. Because nobody owns confirming the handoff happened correctly, the receiving team cannot assume the data arrived intact. Since they cannot assume it, they check it themselves before using it. That checking, by definition, is reconciliation cost.

Cause, Not Coincidence

This is worth stating plainly, since it is a stronger claim than simply noting the two ideas relate. Unowned ownership does not merely correlate with higher reconciliation cost. It produces it directly, as an unavoidable consequence. A team with no reason to trust a handoff has exactly one option available to them: verify everything by hand. There is no third path.

Deloitte’s 2025 Global Business Services Survey found that matrixed ownership structures, where accountability is distributed with genuine business-unit authority rather than concentrated centrally, consistently outperformed centralized models. The reason tracks directly onto this mechanism: a matrixed structure is more likely to assign someone specific to a transfer point, while a centralized one tends to assign ownership only at the category level, leaving the handoff itself uncovered.


Following the Money From the Handoff to the Ledger

Trace one specific handoff to see this play out concretely. A merchandising team updates a product record and passes it forward, assuming compliance will catch anything that needs review. Compliance assumes merchandising already handled what needed handling. Neither team is wrong about their own half of the process. The gap sits in the space between them, where the two halves are supposed to meet and don’t.

Weeks later, a data team notices two reports do not agree. Nobody told them to expect a discrepancy, so nobody flagged it before it reached them. They spend the afternoon manually tracing which system is right, hours that get logged against a dozen different task categories, never against the actual cause.

That afternoon is reconciliation cost. Its origin was never a data problem. It was a handoff nobody owned, three departments removed from where the bill eventually landed.


What Changes When Ownership Closes the Cost

Naming a data owner for a category does not, by itself, reduce this cost. A title covering “product data” in general still leaves the specific transfer point between merchandising and compliance untouched.

What actually closes the cost is narrower and more specific: a named owner for the handoff itself, someone accountable for confirming the transfer happened correctly, not just for the data sitting on either side of it.

The Same Fix, Read Two Different Ways

Described one way, this fix closes an accountability gap. Described another way, the identical fix reduces a line item, fewer hours spent on manual re-verification, because the underlying trust problem no longer exists. Both descriptions are correct, and both point back to the same single intervention: naming an owner for the moment of transfer, not just the data itself.


Is Your Reconciliation Cost Ownership or Effort?

Six honest questions separate a reconciliation cost problem that is genuinely about effort from one that is actually about ownership.

Tracing the Cost

  • Could you name the specific handoff point most of your reconciliation hours trace back to?
  • Is there one person accountable for confirming that handoff happens correctly, separate from whoever owns the data category itself?
  • Would a missed handoff be visible before it reaches the team that has to manually fix it?

Testing the Fix

  • If you named an owner for one specific handoff today, would reconciliation hours in that area actually drop, or just move somewhere else?
  • Has your organization ever tried adding more people to reconciliation work, rather than adding ownership to the handoff producing it?
  • If the answer to the first question was no, would anyone in your organization currently know where to start looking?

Outcome guide: Three or more “no” answers means your reconciliation cost is very likely an ownership problem still being treated as an effort problem, more hands doing the same manual work, rather than one handoff finally getting a name attached to it.


Key Takeaways

  • Reconciliation cost, manual labor spent re-verifying untrusted data, has a specific, identifiable root cause rather than a diffuse one
  • IBM names erosion of stakeholder trust as one of four direct consequences of poor data quality, and this piece traces the specific mechanism behind that erosion
  • Deloitte’s 2025 research found matrixed ownership structures outperform centralized ones, consistent with the argument that transfer points need named accountability, not just category-level ownership
  • An unowned handoff between departments removes the receiving team’s ability to trust that data arrived correctly, forcing manual verification as the only remaining option
  • Naming an owner for a data category does not close this cost. Naming an owner for the specific handoff point does

Why Syndigo SIs Lose Deals Before Implementation Ever Starts

A flat vector illustration of two Syndigo SI consultants seated separately in a waiting area outside a conference room, one lit in navy, one in burnt orange, with two silhouetted figures visible through the frosted glass door between them.

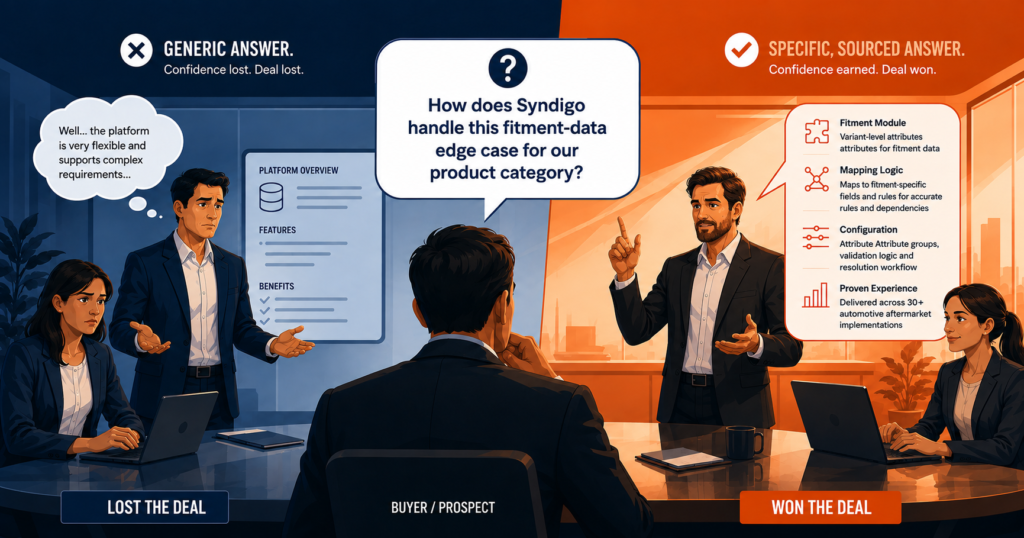
Picture a regional Syndigo SI walking into a pre-sales meeting fully prepared on paper. Certified consultants, a solid delivery track record, every technical box checked. The prospect asks one specific question, how the platform handles a fitment-data edge case particular to their category. The room hesitates, and the confidence the deal needed to survive the next round goes with it.

Three weeks later, a competitor with a thinner delivery bench but a sharper answer to that exact question wins the business. The difference came down to something specific and fixable.

In brief

  • Most lost Syndigo deals fail in the pre-sales conversation, before implementation ever begins
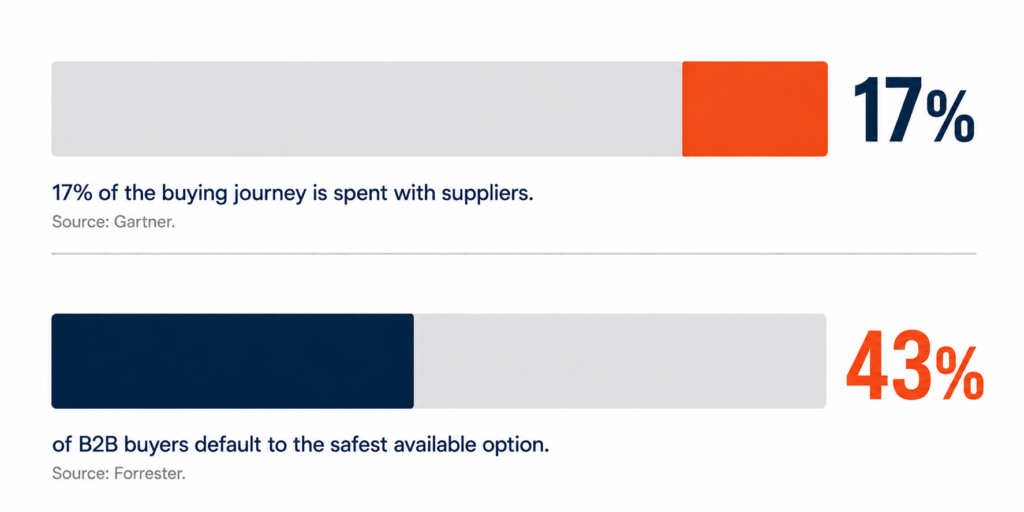
  • Buyers now spend only 17% of the total purchase journey meeting with suppliers, leaving little room to recover from a generic answer
  • 43% of B2B buyers report making defensive purchase decisions more than 70% of the time, favoring the SI that reduces their risk over the one with the most polished pitch
  • The gap between winning and losing SIs usually comes down to the depth and specificity a team can bring to a single hard question, on the spot

The pre-sales depth gap, in this context, means the difference between an SI that can describe what Syndigo does in general terms and an SI that can answer a specific, category-level question with certainty, using Syndigo’s own history, architecture, and ecosystem standing as evidence.

Where Syndigo Deals Actually Get Lost

Where do most Syndigo implementation deals actually fall apart? They fall apart before implementation begins, in the pre-sales conversation, the moment a prospect asks a specific question and you answer with something closer to a platform overview than a real answer.

A split illustration showing two Syndigo SI consultants in a pre-sales meeting, one on the navy side giving a vague, generic answer to a fitment-data question and losing the deal, one on the burnt orange side giving a specific, sourced answer with named platform detail and winning the deal.

This matters more today than it did even a few years ago. Gartner’s own research confirms buyers now spend only 17% of their total purchase journey meeting with suppliers at all. Split across every SI a prospect evaluates, your window shrinks further still, and there is very little time inside it to recover from a generic answer.

What Buyers Are Actually Testing in Pre-Sales

Most pre-sales preparation focuses on proving delivery capability, certified consultants, past projects, a clean track record. That preparation answers a question the buyer has usually already settled by the time you’re in the room. The unsettled question is narrower and harder, and it follows your team into every conversation that comes next: does this specific group understand the platform well enough to be trusted with our specific problem.

Why Technical Capability Isn’t the Problem

That unsettled question is exactly where technical capability stops mattering as much as it should. A team can have genuine, deep implementation skill and still lose a deal in pre-sales, because implementation skill and pre-sales credibility are two different capabilities, built and demonstrated in different ways.

Delivery capability gets proven through a portfolio. Pre-sales credibility gets tested live, in the room, in response to a question nobody scripted for. Most SI training investment goes toward the first capability, since it is easier to structure, certify, and measure.

Why the Pre-Sales Depth Gap Exists

The imbalance has a clear cause. Delivery skill has a formal path, exams, credentials, and structured curricula all validate it in a repeatable way:

  • Exams and certifications validate implementation competence in a structured, repeatable way
  • Credentials give buyers an external signal of technical readiness
  • Structured curricula teach delivery methodology step by step

Pre-sales product depth has no equivalent path. Nothing formally teaches the ability to answer an unscripted, category-level question on the spot, which is exactly why it develops unevenly. One or two people end up carrying the depth the whole team needs.

Why the Depth Gap Is Sharper in Regulated Categories

That unevenness shows up fastest in categories like healthcare or automotive aftermarket, where product attributes carry compliance weight. A prospect in these categories often opens with a compliance-adjacent question specifically because they are testing whether the SI understands the regulatory stakes behind the platform mechanics. A generic answer here reads as a double risk signal, both platform inexperience and category inexperience at once.

What Is a Skeptical Buyer Actually Asking?

That double risk signal is really a version of one question every buyer is quietly asking underneath whatever they say out loud. What is a skeptical buyer actually trying to learn in a pre-sales meeting? Whether choosing your team is the safer decision. Forrester’s own research on B2B buying found that 43% of buyers admit to making defensive purchase decisions more than 70% of the time, choosing the option that felt safest even when a more innovative one was on the table.

An infographic showing that 17% of the B2B buying journey is spent with suppliers, sourced from Gartner, and that 43% of B2B buyers default to the safest available option, sourced from Forrester.

A specific product question, like the fitment-data edge case from the opening, works as a proxy test. The buyer is really asking whether your team has genuinely lived inside the platform long enough to be trusted with everything that comes up later, the parts of the project nobody has thought to ask about yet.

A Vague Answer Reads as a Risk Signal

A generic response to a specific question confirms the exact fear a defensive buyer already carries, that this team has not gone deep enough to be safe. That impression is harder to reverse than a single lost point in a longer conversation, since it colors how the buyer reads everything that follows it.

What Separates SIs Who Win From SIs Who Don’t

That colored impression is what separates the two outcomes this piece opened with. The SIs who consistently win Syndigo deals share one identifiable habit. They answer specific questions with specific, sourced detail, drawn from real product knowledge rather than a rehearsed talking point.

Generic PitchSpecific, Credentialed Answer
Platform history“Syndigo is a leading PIM/MDM platform”Names the platform’s actual scale and standing in the category
Ecosystem standing“We are a certified Syndigo partner”Names the specific role, Advisory Board seat, partner tenure, and what that access has produced
Product depth“The platform handles that use case”Walks through exactly how, naming the specific configuration or module involved
Track record“We have delivered similar projects”Names the recurring problem solved across multiple engagements
Objection handling“We can work through that limitation”Names the specific workaround or roadmap detail, showing the limitation was already anticipated

The Depth Gap in Practice

Return to the fitment-data question from the opening. A generic answer says the platform “supports complex attribute structures.” A specific answer names the exact module handling variant-level attributes, describes how it maps to fitment-specific fields, and states plainly what configuration work that requires.

The same gap shows up in how a track record gets described for that same client. A generic answer offers a list of similar past projects. A specific answer names the recurring pattern across them, three separate automotive aftermarket implementations that each required the same fitment-mapping configuration, and what was learned across all three.

The specific version of each answer takes only seconds longer to deliver, and closes the door on the buyer’s underlying doubt in a way the generic version never can.

Building a Business Case for Syndigo

That closed door is the actual goal, and it requires a different kind of conversation than most pre-sales teams are having. A pitch describes the platform. A business case connects the platform’s specific strengths to the buyer’s specific risk.

Lead With the Platform’s Own Credentials

Syndigo’s ecosystem standing and scale, its market position and depth in the category, is evidence a skeptical buyer weighs heavily. Citing this specifically does real credibility work in the room, well beyond gesturing at “a leading platform.”

Answer the Buyer’s Specific Question First

The instinct under pressure is to widen a hard question into a safer, more general answer. The stronger move answers the narrow question precisely first, then uses that precision to earn trust for the rest of the conversation.

Can Your Team Make This Case Today? A Quick Self-Assessment

Earning that trust is one thing to describe and another to actually be ready for. Six honest questions reveal whether your pre-sales team is prepared for the moment that decides most deals.

Depth and Readiness

  • Could your pre-sales team answer a specific, category-level platform question on the spot, without pausing to check with someone else?
  • Does your team routinely cite Syndigo’s own history and ecosystem standing, or default to general platform language?
  • Has your team ever lost a deal specifically because a narrow technical question went unanswered well?

Preparation and Process

  • Is pre-sales depth something your team actively trains for, separate from delivery certification?
  • Do you know which specific product areas your team is weakest on when questioned live?
  • If a prospect asked the hardest possible question in your category tomorrow, would your team already know the answer?

Outcome guide: Three or more “no” answers means the gap costing deals is not visible yet, and is very likely showing up as lost opportunities currently attributed to price, timing, or fit.

What to Bring Into the Next Pre-Sales Conversation

That outcome guide is also a starting point for what comes next, since the next Syndigo opportunity will very likely include one hard, specific question, the same kind that stalled the room in the opening scenario. Preparing for it means building specific, sourced answers ahead of time, before the pressure of the room tests whether the general pitch holds up.

Name the platform’s credentials specifically. Answer the narrow question first. Treat pre-sales depth as its own discipline, trained deliberately, separate from delivery certification.

That specific kind of preparation, product knowledge deep enough to survive a hard question live, is what ThoughtSpark’s Business Creation work is built to strengthen, closing the gap between your team’s real delivery capability and how convincingly that capability gets proven in the room where the deal is actually decided.

Key Takeaways

  • Formal certification paths exist for delivery skill. No equivalent path exists for pre-sales product depth, which means the gap has to be closed on purpose. It does not close by itself
  • A specific answer takes only seconds longer to deliver than a generic one, and closes the exact doubt a generic answer leaves open
  • Delivery capability and pre-sales credibility are different skills, and most SI investment goes toward the former, since a formal training path exists for it and none exists for the other
  • A specific, sourced answer to a narrow question reads as far more credible than a longer, general one
  • In regulated categories like healthcare or automotive aftermarket, a vague answer to an early question reads as a double risk signal, both platform and category inexperience at once

Why Most CFOs Cannot Measure the Cost of Bad Data 

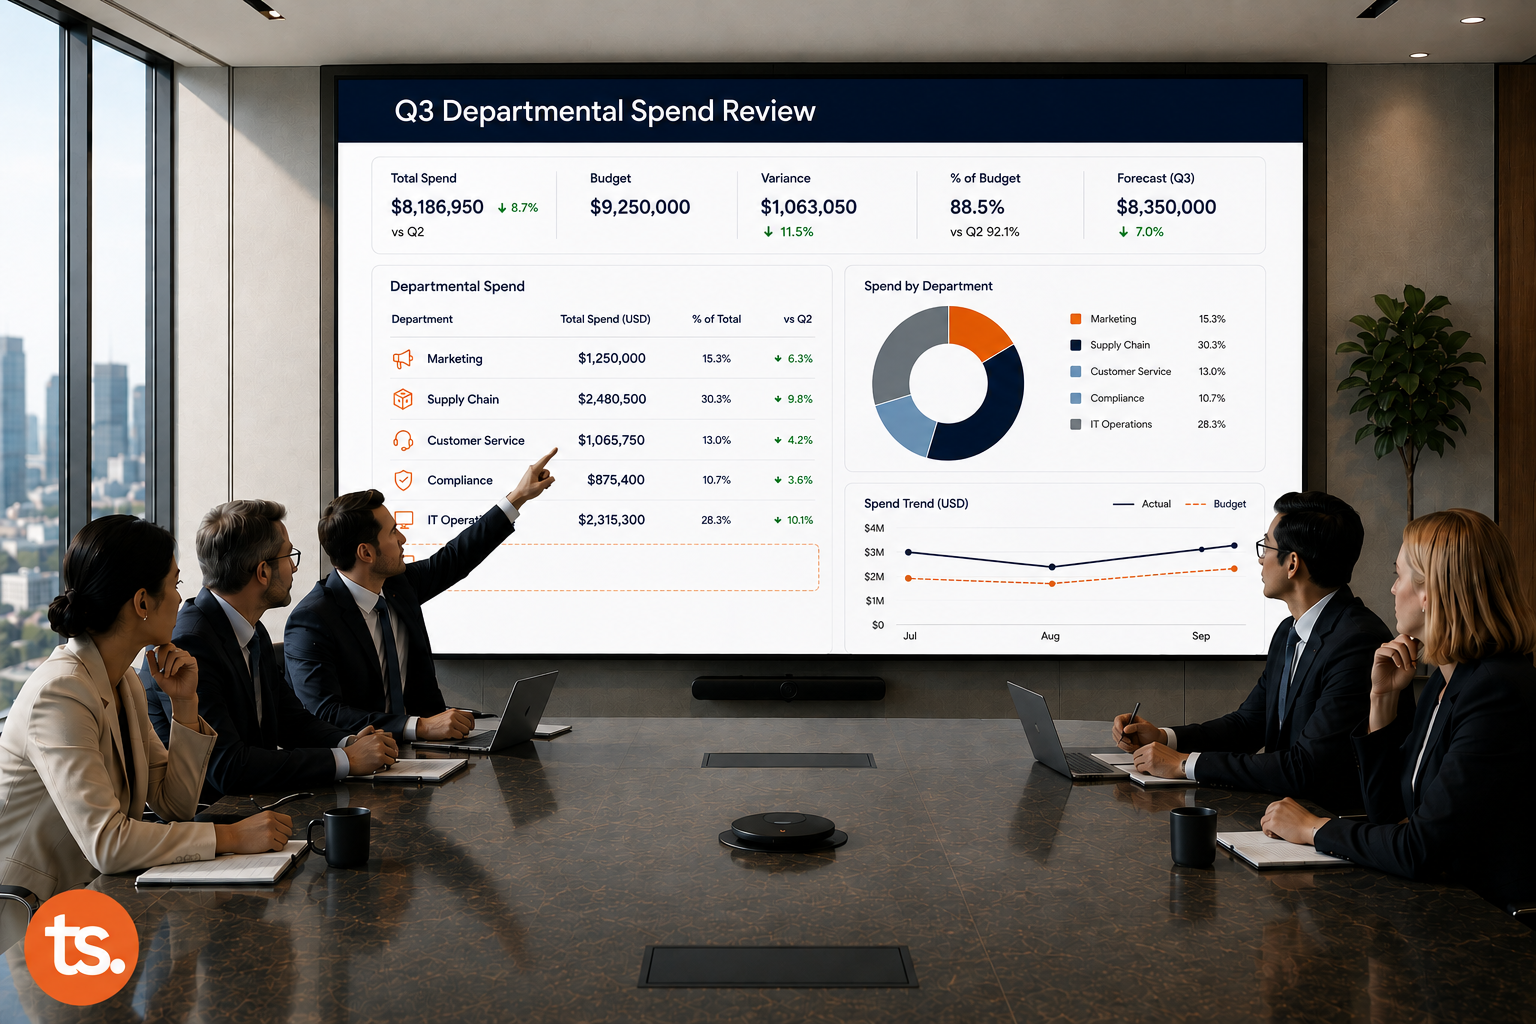
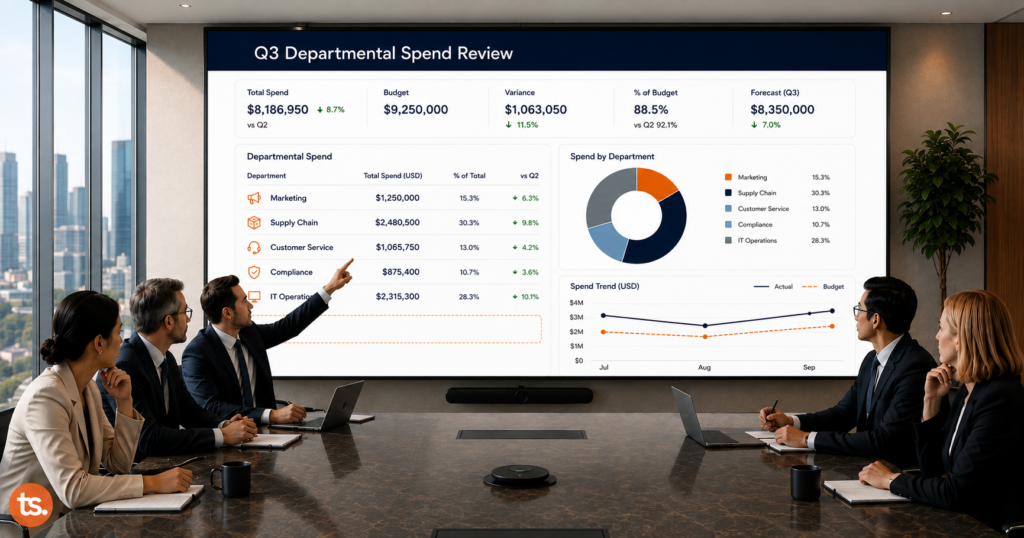
A boardroom presentation of a Q3 departmental spend dashboard, with a presenter pointing at a fully populated spending table that ends in one empty, dashed row, representing the missing line item for the cost of bad data.

Every business exists to make money, and most executive rooms can tell you, without hesitation, that bad data is costing them some of it. What almost none of them can tell you is how much. The number was never built to be counted.

Picture a mid-size retailer that mismaps one attribute field during a catalog migration. Two thousand SKUs go live underpriced by an average of eleven percent. Nobody notices for six weeks. By the time finance flags the margin miss in a monthly review, merchandising is blaming the pricing team, the pricing team is blaming IT, and IT is investigating an integration issue that turns out to be one wrong field. The margin hit gets logged. The words “bad data” never appear on any document that describes it.

That is the actual shape of this cost, a hundred quiet failures rather than one dramatic one, each filed under someone else’s name.

In brief

  • The cost of bad data is widely felt and rarely priced, because it lives in several departments at once and no single role is responsible for adding the pieces together
  • IBM’s research confirms this pattern directly: 43% of chief operations officers now rank data quality as their top data priority, a sign the pain has reached far beyond data teams themselves
  • PwC’s 2026 research on CFO priorities finds finance leaders under growing pressure to prove returns on every investment, which is exactly why an unverifiable estimate stalls before it’s understood
  • The cost consistently splits into four categories, each tracked by a different team, which explains why it reads as several small problems rather than one large one
  • Finance rarely rejects a data cost estimate because the problem isn’t real. It rejects estimates it cannot verify against its own numbers

The cost of bad data, in this context, means the total financial impact of inaccurate, incomplete, or inconsistent data across an organization, including decision errors, automation failures, labor spent on reconciliation, and regulatory exposure, whether or not any single department has measured its own share of it.

What Bad Data Actually Costs, Beyond the Team That Notices It First

A sales team living with a bad lead list calls it a sales problem. Finance, dealing with a forecasting error six weeks later, calls it a modeling problem. Compliance, filing an audit finding, calls it a governance problem. Three teams, one shared cause, three different names for it.

IBM names four distinct types of consequence sitting underneath these labels: distorted decision-making, amplification through automation, erosion of trust among stakeholders, and compliance risk. Four teams, four symptoms, one root failure, told in four separate vocabularies.

IBM also found that 43% of chief operations officers now name data quality as their single most significant data priority. An operations leader, not a data specialist, saying this out loud is a signal worth taking seriously.

One Root Cause, Four Different Names

Return to the mismapped attribute. Monday, a leader signs off on a promotional pricing plan built from the same flawed catalog feed, unaware the underlying numbers are already wrong. Tuesday, an automated repricing system ingests the same feed and applies the error across every SKU it touches, not just the original two thousand. Wednesday, a data analyst notices two reports don’t reconcile and spends the day manually cross-checking, hours nobody budgeted for. Friday, a routine compliance review flags an inconsistency in product attribute records, unrelated in the auditor’s mind to anything from earlier that week.

One record. Four consequences. Five days. Almost nobody in that building will ever connect Monday to Friday.

Why the Same Failure Never Adds Up to One Number

Each department’s reporting system tracks its own function well. None of them share a label for “this traces back to a data quality issue.” So the connection has nowhere to live.

The margin miss from the pricing error shows up in a revenue report, filed as underperformance. The compliance finding shows up in an audit log, filed as a governance gap. Both documents are accurate. Neither one mentions the other. Read separately, each tells half a story, and the missing half is the part that would reveal the actual size of the problem.

This is not a hidden cost. Hidden costs sit somewhere waiting to be found. This cost is dispersed, spread across four places at once, and dispersal is harder to solve than concealment, because nobody’s job is to look in four places simultaneously and add what they find.

The cost of bad data does not hide behind a single number. It exists between several small ones, none large enough on its own to justify action.

The Four-Category Framework for Pricing Bad Data

Naming the problem explains why it stays invisible. Pricing it requires four categories, translated into language a finance team already speaks.

“Why not just use an industry benchmark instead of building all this internally?” It’s a fair question, and the honest answer is that a benchmark tells you what happened somewhere else, not what happened here. The four categories below exist precisely because “somewhere else” never survives a room full of people asking about this specific balance sheet.

What are the four categories where the cost of bad data actually shows up? Decision cost, propagation cost, reconciliation cost, and regulatory cost.

CategoryWhere It OriginatesWhere a Finance Team Would Find It
Decision CostA strategic call made on a flawed dashboard or forecastMissed revenue targets, mispriced offerings, misallocated budget
Propagation CostBad data entering an automated or AI-driven systemThe same error repeated across every output the system touches
Reconciliation CostManual labor spent re-verifying data nobody trustsHeadcount hours logged against cleanup, folded into other tasks
Regulatory CostWeak governance exposing the organization to compliance riskFines, audit remediation, legal spend tied to data findings

Decision Cost

The eleven-percent underpricing example is decision cost in its purest form. A leader trusted a dashboard. The dashboard was wrong. Six weeks passed before the trust was tested.

That gap, between the decision and the discovery, is why this category resists tracing. By the time the consequence surfaces, the flawed data has usually been overwritten. Someone has to want to find the original cause. Most people, holding a plausible explanation already, don’t.

Propagation Cost

Bad data entering a human-reviewed process creates one mistake. Bad data entering an automated one creates a multiplier. The repricing system from Tuesday didn’t repeat the original error once. It repeated it across every SKU it touched, at machine speed, before any person saw a single output.

This is the category growing fastest right now. AI adoption means more decisions route through systems built for speed, not for the pause a person occasionally takes to ask whether a number looks wrong.

Reconciliation Cost

Wednesday’s analyst is the easiest character in this entire story to find inside a real organization. Someone, somewhere, is spending real hours right now reconciling two systems that disagree. That labor rarely gets logged as “data quality,” and instead gets folded into general task time, disappearing into a spreadsheet nobody built to catch it. That invisibility is the opportunity here, not the obstacle, since the underlying hours already exist in a timesheet somewhere and simply haven’t been tagged by cause.

Regulatory Cost

Friday’s compliance flag lands as a line item in a legal budget, disconnected from the pricing error four days earlier that shares its root cause. The fine gets paid. The upstream gap that produced it stays open, and produces the next fine on a similar timeline.

How Finance Actually Evaluates a Data Cost Estimate

Everything above explains where the cost lives. It doesn’t yet explain why a well-researched estimate still gets rejected in the room. This is the part most conversations about bad data skip, and it’s the part that decides whether any of the previous four sections ever turn into a funded initiative.

Finance Rejects Numbers It Cannot Verify, Not Numbers It Doubts

A CFO who hears “bad data costs us millions” is not doubting the claim. Most already believe some version of it. What stops the request is simpler: the number arrives with no visible math behind it, and finance’s job, structurally, is to interrogate math.

PwC’s own research into 2026 CFO priorities describes finance leaders operating under exactly this pressure, expected to prove returns on every AI and digital investment they approve, while managing what PwC directly calls fragmented data and shrinking budgets. A number without a visible source doesn’t just fail to persuade in that environment. It actively works against the person presenting it, since approving it would mean the CFO cannot in turn prove the return if challenged themselves.

An industry benchmark fails this test immediately, because it was never measured against this company’s own systems. A labor-cost figure built from actual logged hours passes it, because finance can trace every dollar back to a timesheet it already trusts. This is why reconciliation cost, the least dramatic of the four categories, is consistently the one that survives a first budget review. It’s the only category that arrives already speaking finance’s native dialect: hours, rates, totals.

What Actually Clears a Budget Review

Three things separate a request that clears review from one that doesn’t. A defensible floor, not a dramatic ceiling, since an inflated number invites the exact scrutiny that kills a request before it’s understood. A named source for every figure, so a skeptical question has a direct answer rather than a shrug. And a scope small enough to audit in one sitting, which is why a single measured category beats a sweeping company-wide claim almost every time.

Capital allocation decisions inside most finance functions favor the request that’s easiest to verify over the request that’s largest in size. That single fact explains more about why data initiatives stall than any argument about the size of the underlying problem ever will.

Building the Ledger, Starting With One Category

Start smaller than a company-wide audit. Prove the method works once before asking anyone to trust it everywhere.

  1. Start with reconciliation cost. The data usually already exists in a timesheet or task tracker. The work here is retrieval, not collection.
  2. Tag existing entries by root cause. Go back through recent logs and mark which hours trace to a genuine data issue, not general friction.
  3. Convert the total into a dollar figure, using fully loaded labor cost, the exact unit finance already applies to every other line item.
  4. Repeat for the remaining three categories, one at a time. Attempting all four at once is how these efforts stall before producing anything usable.

The first category, once actually measured, is often large enough on its own to justify the initial request. The other three become the case for staying funded.

Six Questions That Reveal Whether This Cost Is Priced or Just Felt

[Visual: Self-Assessment Card — light-background checklist card, consistent with the established site format.]

Visibility and Ownership

  • Could anyone in your organization name a single dollar figure for the total cost of bad data today?
  • Is there one person accountable for consolidating that figure across departments, or does each team track its own piece?
  • Would a data issue in one department ever get connected to a cost showing up in a completely different one?

Measurement and Language

  • Do you track reconciliation hours, incident frequency, or resolution time by root cause?
  • Would a figure presented to your CFO today already speak in finance’s own terms, or need translation first?
  • Is your current estimate, if one exists, a conservative floor or an inflated worst case?

Outcome guide: Three or more “no” answers means the cost currently exists as a felt pain, not a defensible figure. That’s the exact condition that stalled the pricing team’s funding request six weeks after the original error, and the exact condition most requests stall inside.

What to Bring Into the Room

The retailer from the opening never got the chance to prevent its pricing error. The next one can, but only with a repeatable way to build the ledger before the next mismapped field turns into six quiet weeks nobody can explain. That repeatability is the whole point. A single measured category proves the method works. A named owner, a finance-native vocabulary, and a conservative floor make it something a CFO can actually approve, and the four categories together give an organization a standing answer, not a one-time favor, the next time this question comes up.

That is exactly the capability ThoughtSpark’s Data & AI Strategy and Data Readiness Hub practice is built to provide, for finance and data leaders who would rather walk into that next conversation with a number than a feeling.

Key Takeaways

  • Only 43% of chief operations officers name data quality as their top priority, despite its cost touching nearly every function, per IBM
  • PwC’s 2026 CFO research finds finance leaders under mounting pressure to prove returns on every investment, which is exactly why unverifiable cost estimates rarely survive a budget review
  • The cost splits into four measurable categories: decision cost, propagation cost, reconciliation cost, and regulatory cost
  • Finance rejects estimates it cannot verify, not estimates it doubts, which is why labor-cost figures outperform industry benchmarks in a budget review
  • A defensible number needs a named owner, finance’s own vocabulary, and a conservative floor rather than a worst-case ceiling
  • Reconciliation cost is the fastest category to measure, since the underlying hours usually already exist in a timesheet, just untagged