
What if the correction sprint is not a sign that your data quality programme is failing?
What if it is a sign that your programme was never designed to prevent it in the first place?
That is an uncomfortable question if you have spent the last two years building governance frameworks, assigning data ownership, migrating to a new platform, and watching quality scores trend in the right direction. Because it implies that the problem is not in how well you executed those things. It is in what those things were built to do.
Most data quality programmes are built to manage the correction cycle more effectively. Better tools to catch errors faster. Better ownership to ensure someone is accountable when errors occur. Better metrics to track whether the volume of errors is decreasing. These are all reasonable responses to a visible operational problem and they produce real improvement.
But they are designed around the assumption that errors will keep occurring and that the job is to manage them better.
The organisations where product data quality is genuinely stable made a different assumption. They asked a different question. Not “how do we manage errors more effectively” but “how do we build an environment where errors are significantly harder to create in the first place.”
That question leads somewhere different. And the answer to it is what this blog is about.
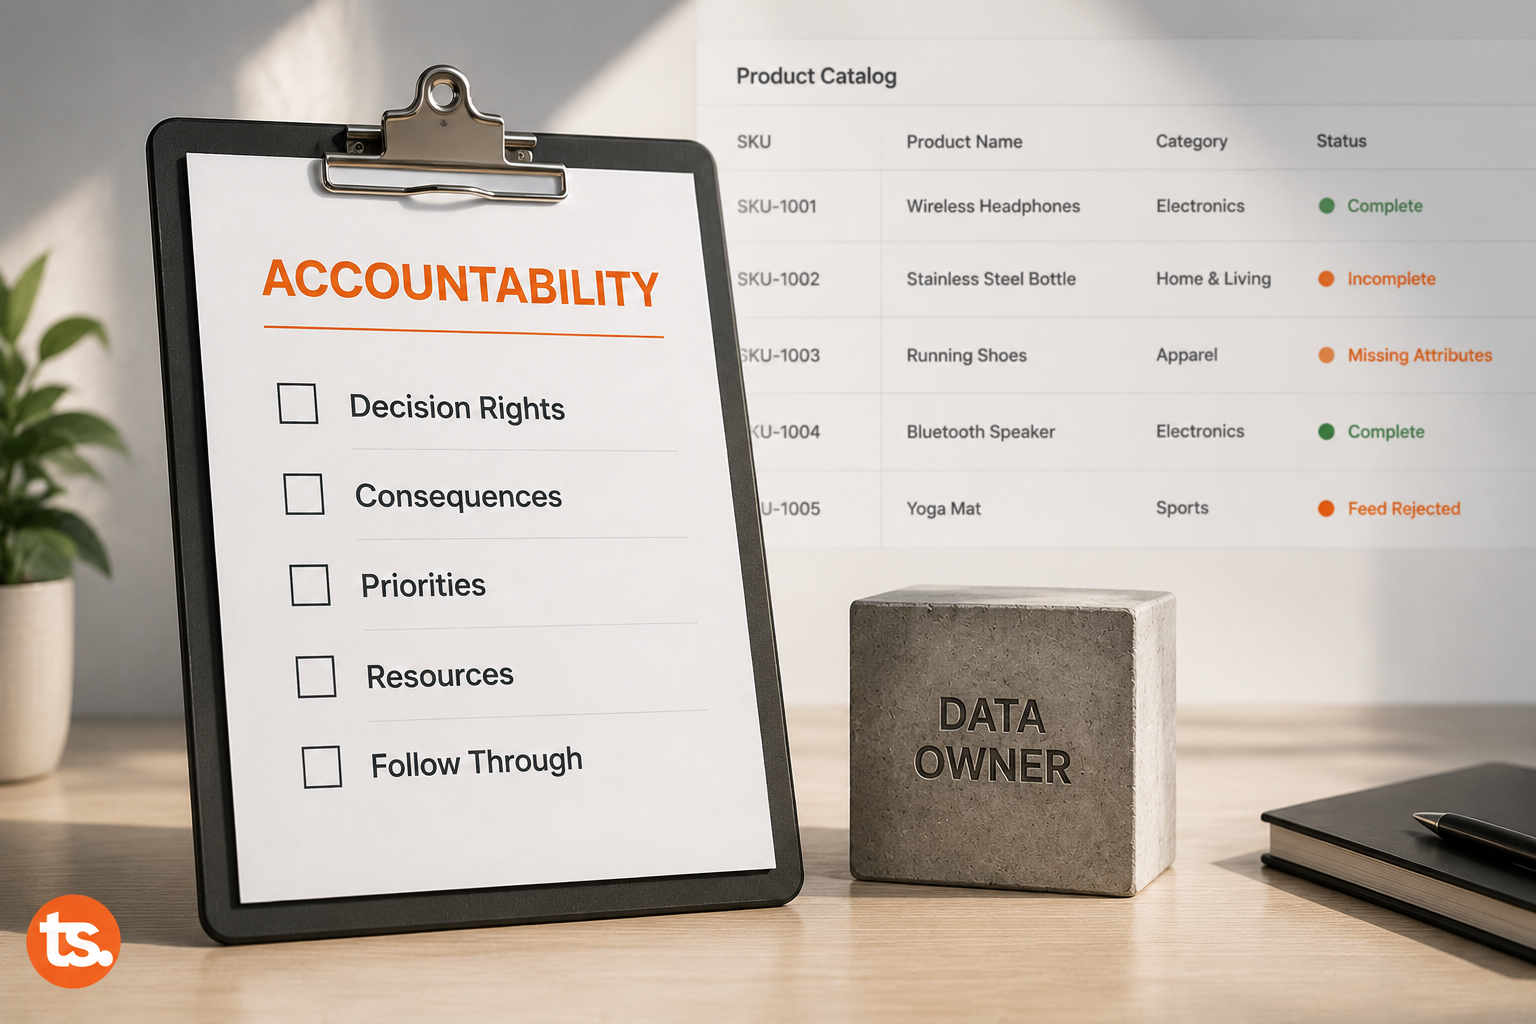
Key takeaways
- Stable product data quality is not achieved by fixing bad data better. It is built by making bad data significantly harder to create and progress through your system in the first place.
- Getting there requires two shifts simultaneously: system design that enforces quality at the point of creation, and cultural ownership that makes data quality part of how your team thinks about their work every day.
- Neither shift holds without the other. System enforcement without cultural ownership gets worked around. Cultural ownership without system enforcement decays under deadline pressure.
- Wavestone’s 2024 Data and AI Leadership Executive Survey of Fortune 1000 leaders found that 78% identify culture, people, and process as the greatest barrier to becoming data-driven — above any technological limitation. Only 37% have improved data quality despite significant investment.
- The organisations that have made this shift stopped treating data quality as something a project achieves and started treating it as something the operational environment maintains continuously.
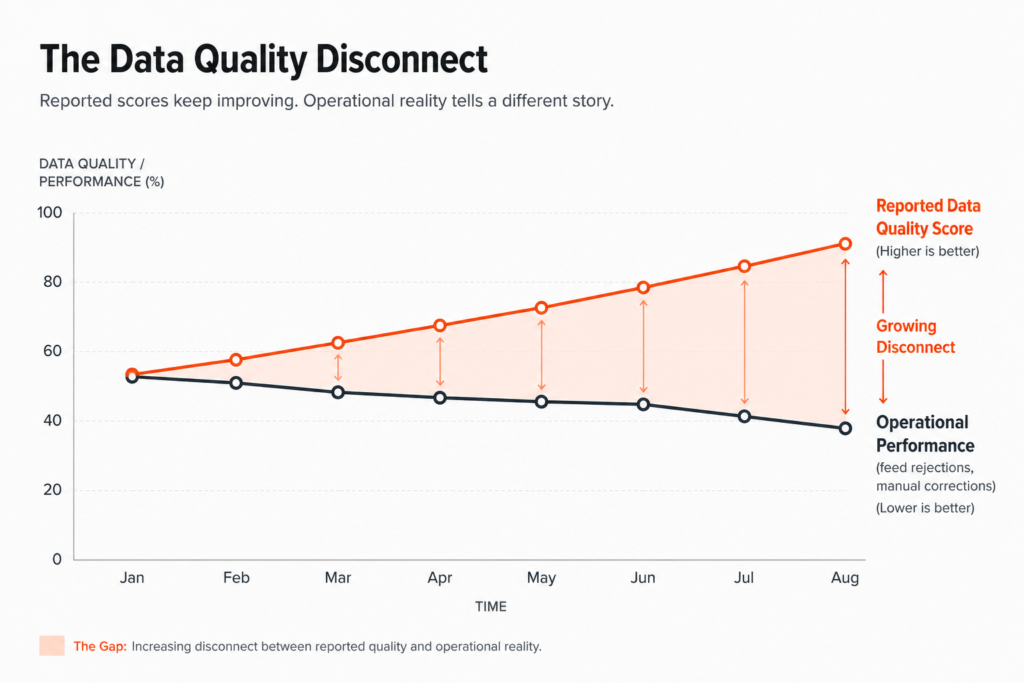
What a Stable Product Data Operation Actually Looks Like From the Inside
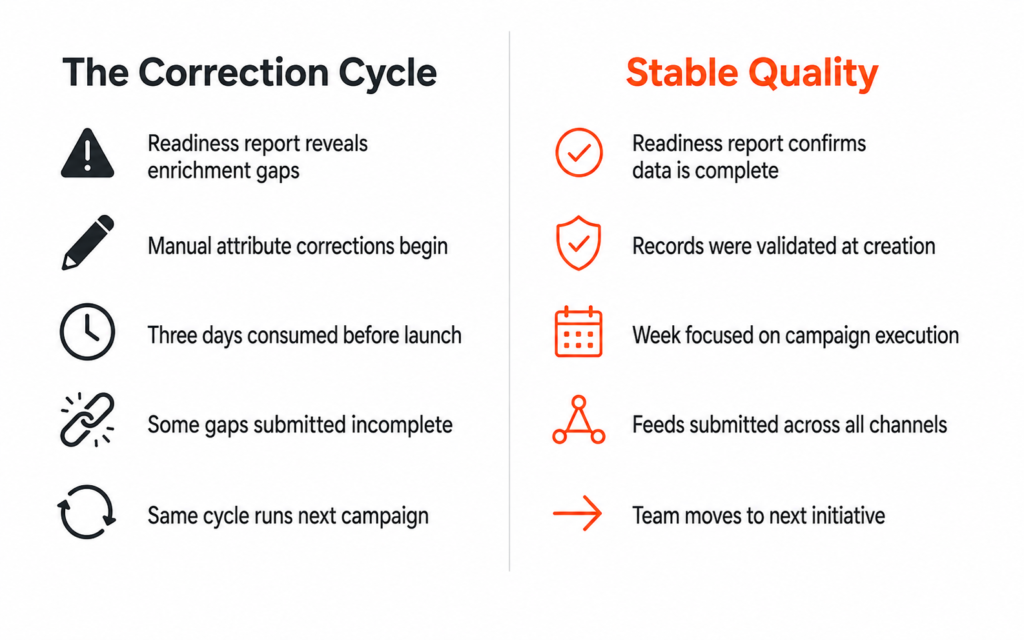
What the week before a campaign launch looks like in a correction-cycle operation versus an organisation where product data quality holds
Before getting into what changes, it is worth being specific about what you are building toward, because “better data quality” is too abstract to be useful as a destination.
Here is what it looks like when product data quality is genuinely stable in your operation.
Your product manager finishes building a new range. The records go live already complete — not complete enough to pass a manual review later, complete against the actual requirements of every channel the products will be sold through. They were built that way because your system made building them any other way slower than building them right.
Your supplier sends a data file. It goes through automated validation on ingestion. The records that meet the standard enter the active catalogue. The records that do not are quarantined immediately, flagged for resolution, and never reach a state where they could cause a feed rejection six weeks from now.
Your team opens the readiness report the week before a campaign. It is a confirmation, not a discovery. There is no sprint. There is no last-minute escalation. There is no quiet agreement to submit with known gaps because the window is closing.
That is not a description of a perfect organisation with unlimited resources and a decade-long transformation behind it. It is a description of what becomes operationally normal once two specific shifts have been made — and it is achievable faster than most data leaders expect once both shifts are being made simultaneously.
The Two Shifts That Separate Stable Quality From the Correction Cycle
If you have run a governance initiative, a platform migration, a data ownership programme, or a quality improvement project and still find yourself in the same correction cycle six months later, the reason is almost always the same.
You made one shift. You needed two.
Most investments in product data quality address either the system or the culture. A new PIM, a governance framework, a data stewardship structure, a measurement programme — each one addresses something real and produces some improvement. None of them produces stability on its own, because stability requires both dimensions to hold simultaneously.
The first shift is system design that enforces quality at the point of creation.
Your system needs to make it structurally difficult to create or progress data that does not meet the standard. Not difficult to remember. Not dependent on the right person catching it at the right moment. Structurally difficult, meaning the record cannot move forward until it is compliant, the taxonomy field cannot accept a locally invented value, and the channel-specific requirement is surfaced at creation rather than discovered at submission.
The second shift is cultural ownership of data quality as part of daily work.
Everyone who touches product data — product managers, category teams, supplier management, marketing operations — needs to understand that data quality is part of their job, not a compliance check that happens somewhere downstream. That understanding needs to be established at onboarding and reinforced consistently enough that it holds under deadline pressure, not just when things are calm.
Wavestone’s 2024 Data and AI Leadership Executive Survey, the longest-running survey of Fortune 1000 data leaders, found that 78% of organisations identify culture, people, and process as the greatest barrier to becoming data-driven, placing it above any technological limitation, and only 37% have been able to improve data quality despite significant and sustained investment. The gap between what organisations invest in and what they actually achieve sits almost entirely in the second shift — the one most quality improvement programmes never fully reach.
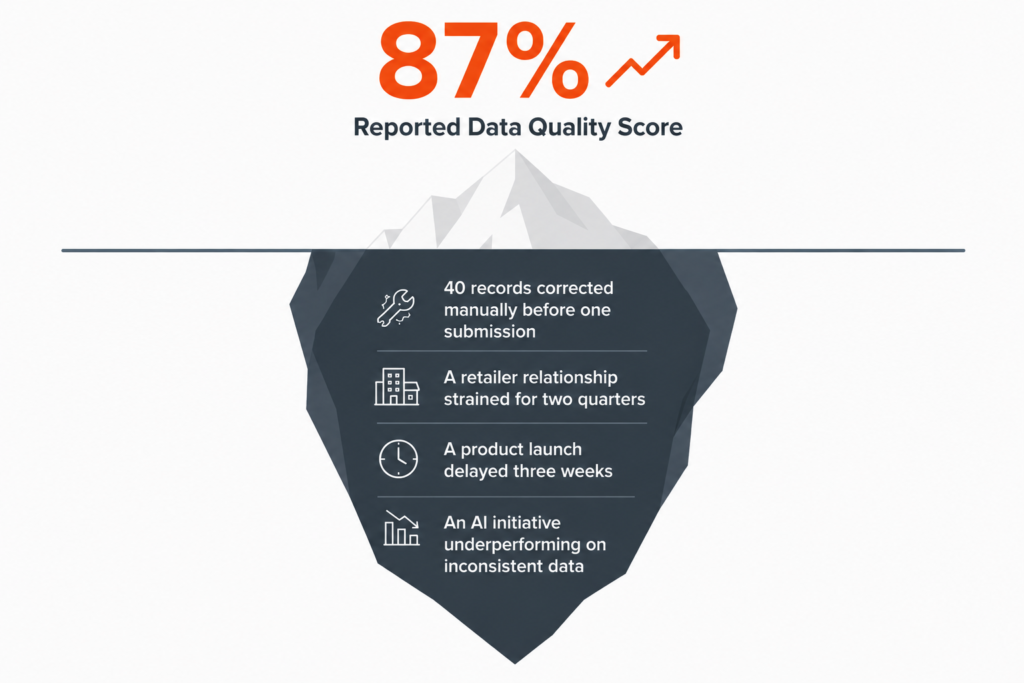
“78% of Fortune 1000 data leaders identify culture, people, and process as the greatest barrier to becoming data-driven — above any technological limitation. Only 37% have improved data quality despite significant investment.”
— Wavestone, 2024 Data and AI Leadership Executive Survey
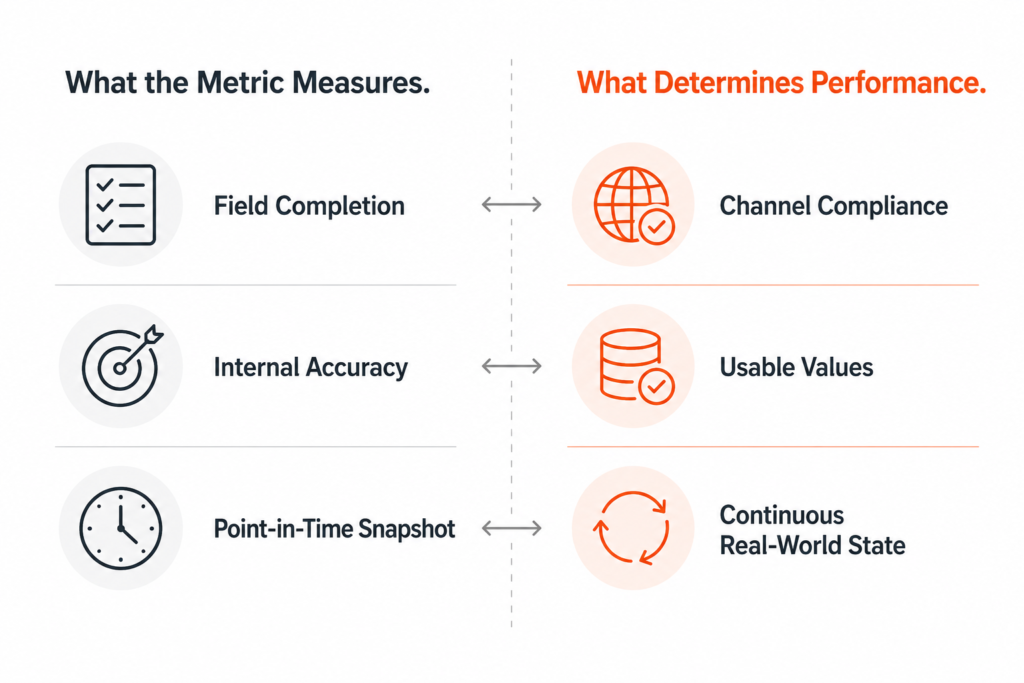
What System Design for Data Quality Actually Looks Like
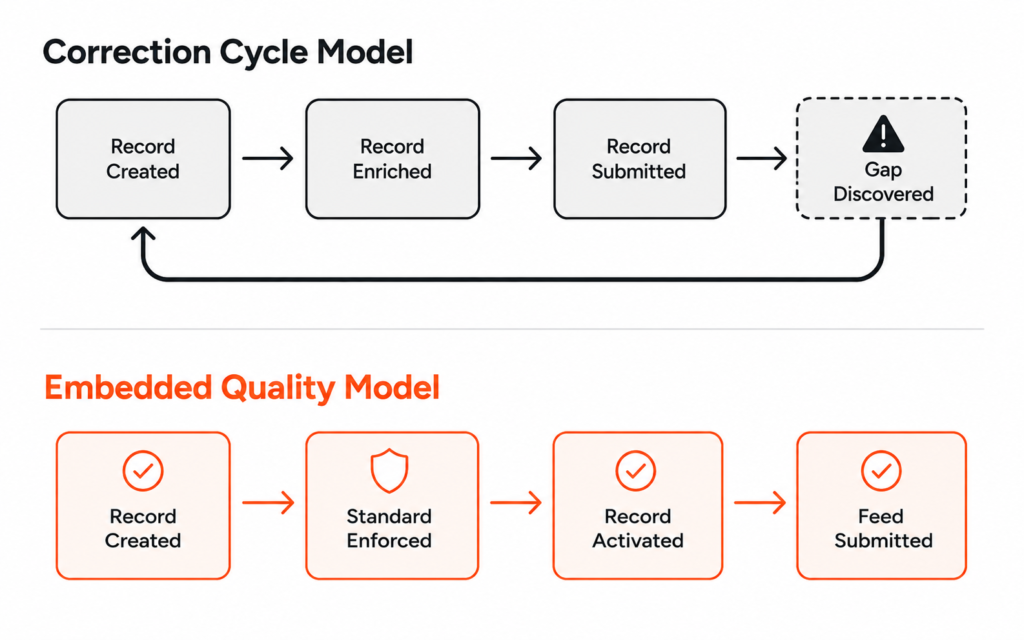
Where quality enforcement happens in a correction-cycle operation versus an organisation with system design for data quality embedded at the point of creation
The most important question about your current system is not which platform you are using. It is where in your process the quality standard actually gets applied.
In most organisations, the honest answer is at the end. The record gets created, enriched, categorised, and submitted. The quality gap becomes visible at submission — or at the retailer rejection that follows. By that point the record has been live in your system for weeks, possibly longer, and fixing it means going back to correct something that should never have been allowed to progress.
In an organisation where quality holds, the standard is applied at the beginning. The record cannot be created without the mandatory fields completed against the actual channel requirements. The taxonomy field is a controlled vocabulary, not a free-text entry point. The enrichment threshold is a validation rule that blocks activation, not a guideline that gets checked later. The quality gap surfaces at creation, when it is fastest and cheapest to close.
Getting your system to that state requires four specific configuration decisions:
- Mandatory field validation that prevents record activation rather than flagging for review. The record cannot go live until the required attributes are present and within the accepted values for each channel it is assigned to.
- Controlled vocabulary for taxonomy classifications. Category, subcategory, and attribute fields are selected from an approved list. Locally invented values cannot enter your taxonomy because the system does not accept them.
- Channel-specific completeness profiles applied at creation. When a product is assigned to a channel, your system surfaces what that channel requires immediately — not when the feed is generated, when the record is being built.
- Supplier data validation on ingestion. Incoming files are checked against your quality standard before records enter the active catalogue. Non-compliant records are quarantined for resolution, not allowed to flow through and create correction work downstream.
None of these require a new platform. Most PIM systems can support all of them with the right configuration decisions. The reason most organisations have not implemented them is not technical. It is organisational — the short-term friction these controls create in the creation workflow feels significant in the moment, and quality improvement programmes rarely have enough sustained authority to push through that friction. The organisations that have made this shift found the friction smaller than expected and the operational improvement larger than projected.
What Cultural Ownership of Data Quality Actually Looks Like
System design is the more tractable of the two shifts because it is definable, configurable, and delegatable. Cultural ownership is harder to define and impossible to delegate, which is why most organisations underinvest in it and then wonder why the system enforcement gets worked around.
Cultural ownership is not a training programme or a data literacy campaign. It is a change in how your team understands their own role. Specifically it is the shift from “I create product records and the data team checks them” to “I am responsible for the quality of the data I create, and the system is there to help me meet the standard.”
That shift requires changing several things simultaneously — what your onboarding process establishes from day one, what gets measured and recognised in team performance, how conversations happen when deadline pressure creates temptation to cut a corner, and how your leadership responds when the quality checkpoint slows something down.
Harvard Business Review research examining a two-year data culture programme at Gulf Bank found that building a data-driven culture requires getting everyone involved, not just the data team, and that data quality is the right place to start — not governance frameworks, not technology investment, not data literacy in the abstract. The organisations that successfully established data cultures started by making data quality a shared operational responsibility rather than a specialist function.
“Cultural change requires getting everyone involved, not just the data team. Give data quality strong consideration as the place to start.”
— Harvard Business Review, What Does It Actually Take to Build a Data-Driven Culture?
In your operation, that translates into something concrete. The product manager who enters an unapproved taxonomy classification needs to understand — specifically, not theoretically — that this decision is the beginning of a drift that will show up as a feed rejection six weeks from now, attributed to the data team, costing hours nobody planned for. That understanding does not come from a policy document. It comes from an onboarding process that makes the connection clear from day one, from a team environment where individual data decisions and their downstream consequences are visible and discussed regularly, and from leadership that holds the standard consistently rather than approving exceptions under deadline pressure.
The organisations that have established this culture did not achieve it through a formal programme. They achieved it through consistent reinforcement of the same standard across enough situations and enough time that the standard became the default expectation rather than an additional requirement layered onto the role.
Why Neither Shift Works Without the Other
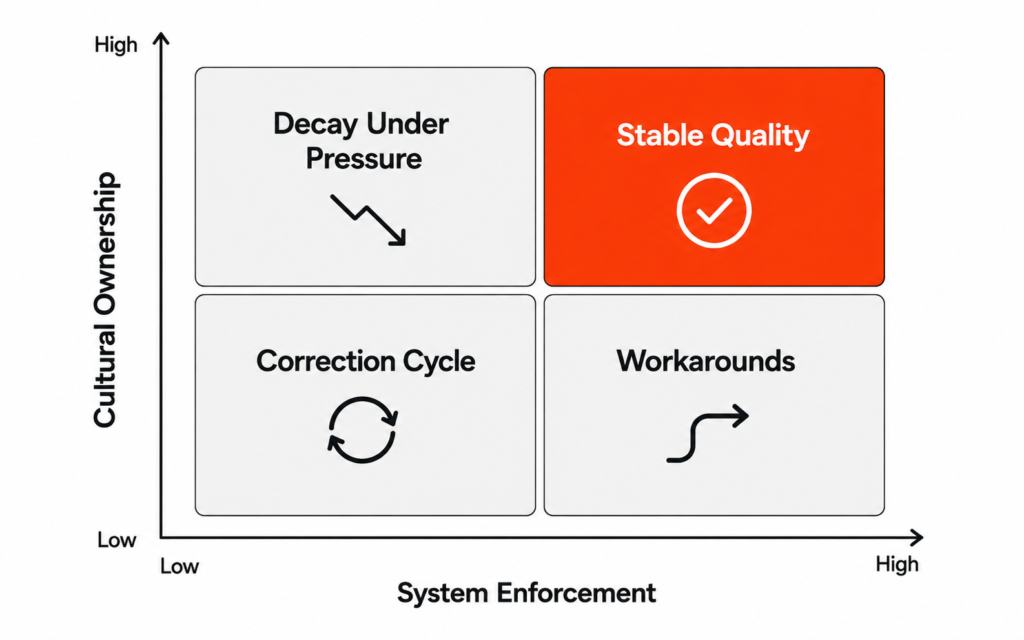
Four operational outcomes determined by the combination of system enforcement and cultural ownership — only the top right quadrant produces stable product data quality
If your system enforces quality standards that your teams have not accepted as their own, watch what happens under pressure. Teams find the fastest path to satisfying the system requirement without changing the behaviour the system was designed to change. The mandatory field gets populated with placeholder text. The controlled vocabulary classification gets selected based on what is closest rather than what is correct. The validation rule that blocks activation gets escalated as an exception rather than resolved at source. Your system is technically satisfied while your quality problem persists in a different form — and your teams have learned that the standard is navigable if you know the right path around it.
If your teams genuinely own data quality as part of their role but your system does not enforce the standard at creation, that ownership holds until the first significant deadline. Then the path of least resistance — submitting the incomplete record, using the unapproved classification, bypassing the review step — becomes the rational choice under time constraint. The cultural commitment was real. The operational environment did not protect it when it mattered. And repeated exceptions under pressure erode the cultural ownership itself, because a standard that is not enforced is not really a standard.
If neither shift has been made, you are running the correction cycle. Data quality is addressed periodically, in response to visible failures, by a specialist team. The sprint runs before every campaign. The rejection triggers an investigation. The quality initiative runs every eighteen months and produces the same result. Nothing has changed structurally and nothing has changed culturally, so the same problems return on the same schedule.
When both shifts have been made simultaneously, your system enforces the standard at creation and your teams understand why the standard exists and accept it as part of how their role is defined. When deadline pressure creates temptation to bypass the checkpoint, cultural ownership makes escalation more likely than workaround. When a new product category creates a situation the system did not anticipate, cultural ownership means your teams raise the gap rather than inventing a local solution that drifts from the standard. The two shifts reinforce each other continuously, and that reinforcement is what makes the quality stable rather than episodically improved.
You cannot make one shift and then add the other. Each one creates the conditions that make the other sustainable. System enforcement without cultural ownership gets worked around from day one. Cultural ownership without system enforcement decays the first time it is tested under pressure. They need to develop together, and that simultaneity is what makes this structurally different from every governance initiative or platform migration you have already run.
How to Know Which Shift Your Organisation Has Actually Made
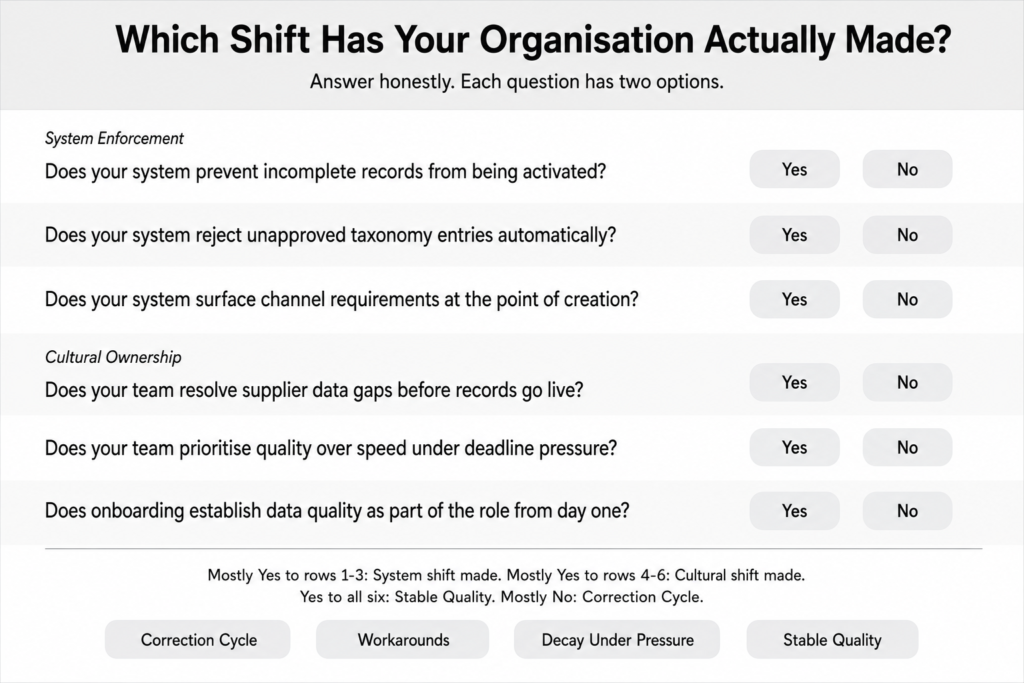
Six diagnostic questions to identify which shift your organisation has actually made — and which quadrant your current operation sits in
Before deciding what to invest in next, it is worth being honest about where you actually are. These six questions will place you in one of the four quadrants more accurately than any governance audit or quality dashboard will.
On system enforcement:
When a product record is created in your PIM with incomplete mandatory attributes, does your system prevent activation or flag it for later review while allowing it to progress?
When a team member enters a taxonomy classification that does not exist in your approved vocabulary, does your system reject the entry or accept free text alongside controlled values?
When a product is assigned to a retail channel, does your system surface the channel-specific attribute requirements immediately at creation or does the compliance check happen later in the process?
On cultural ownership:
When a supplier data file arrives with attributes that do not match your taxonomy standard, does your receiving team resolve the gap before records enter the active catalogue or do the records go live with the expectation that corrections happen before the next submission?
When deadline pressure makes it faster to bypass the quality checkpoint than to resolve the underlying gap, what does your team typically do — and what does their manager reinforce?
When a new team member joins and begins creating product records, does their onboarding establish data quality as part of their role from day one or does it focus on the workflow and leave quality standards as something they learn from the data team over time?
If your honest answers to the first three questions reveal that your system allows non-compliant data to progress, and your honest answers to the second three reveal that quality decisions are made by your data team rather than by the people creating the data, the correction cycle is the predictable outcome. Both shifts are still ahead of you — and your next quality initiative will not change that until you address them simultaneously.
What Changes When Both Shifts Are in Place
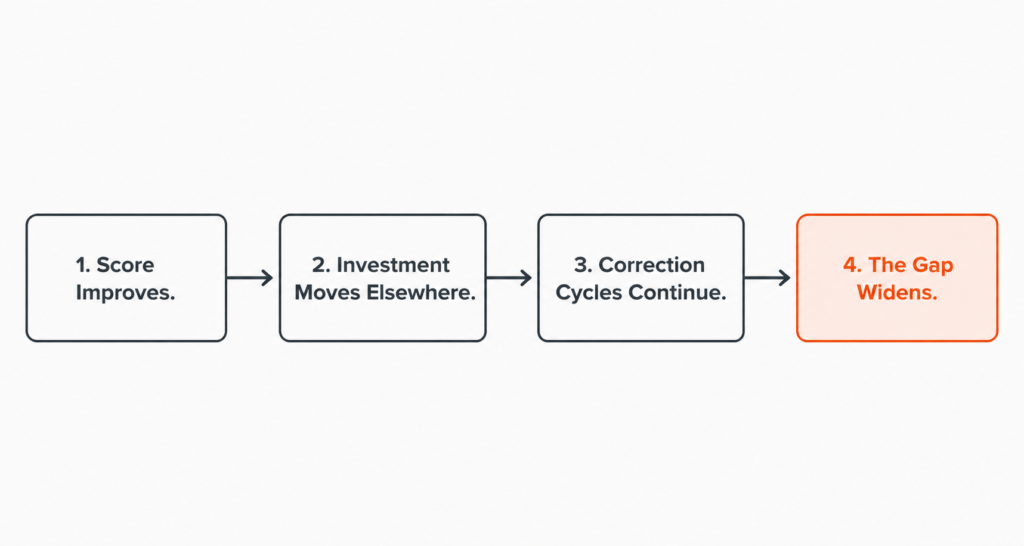
Most organisations treating data quality as a problem to solve keep discovering that the solution does not hold. The governance framework produces results while it is being actively managed and then degrades when attention moves elsewhere. The platform migration improves the environment but the correction cycle returns within two campaign cycles because the data being created in the new environment is no different from the data that was created in the old one. The ownership assignment creates named accountability that never translates into operational behaviour because the system does not enforce it and the culture does not reinforce it.
The pattern is consistent across organisations of different sizes, different industries, and different platform environments. The investment is real. The intention is genuine. The result is always the same because the approach is always the same — treating data quality as something you achieve through a well-executed project rather than something your operational environment maintains continuously.
What changes when both shifts are in place is not a specific metric or a single operational outcome. What changes is the fundamental posture of the organisation toward product data quality. It stops being a problem your data team manages and starts being a condition your operational environment maintains. The correction sprint stops being a standard phase in your campaign planning and starts being an exception that signals something in the system or the culture needs attention.
That shift in posture is what separates the organisations that keep running quality initiatives from the organisations that stopped needing them. And it is available to any organisation willing to address both dimensions simultaneously rather than continuing to invest in one while the other remains unaddressed.
If the questions in this blog surfaced gaps in either shift — or both — the conversation worth having is about what it would actually take to build them simultaneously in your operation. That is the work ThoughtSpark does with enterprise data and commerce teams: identifying the specific distance between where your product data quality currently operates and the conditions that would make it stable, and building the path between the two.