
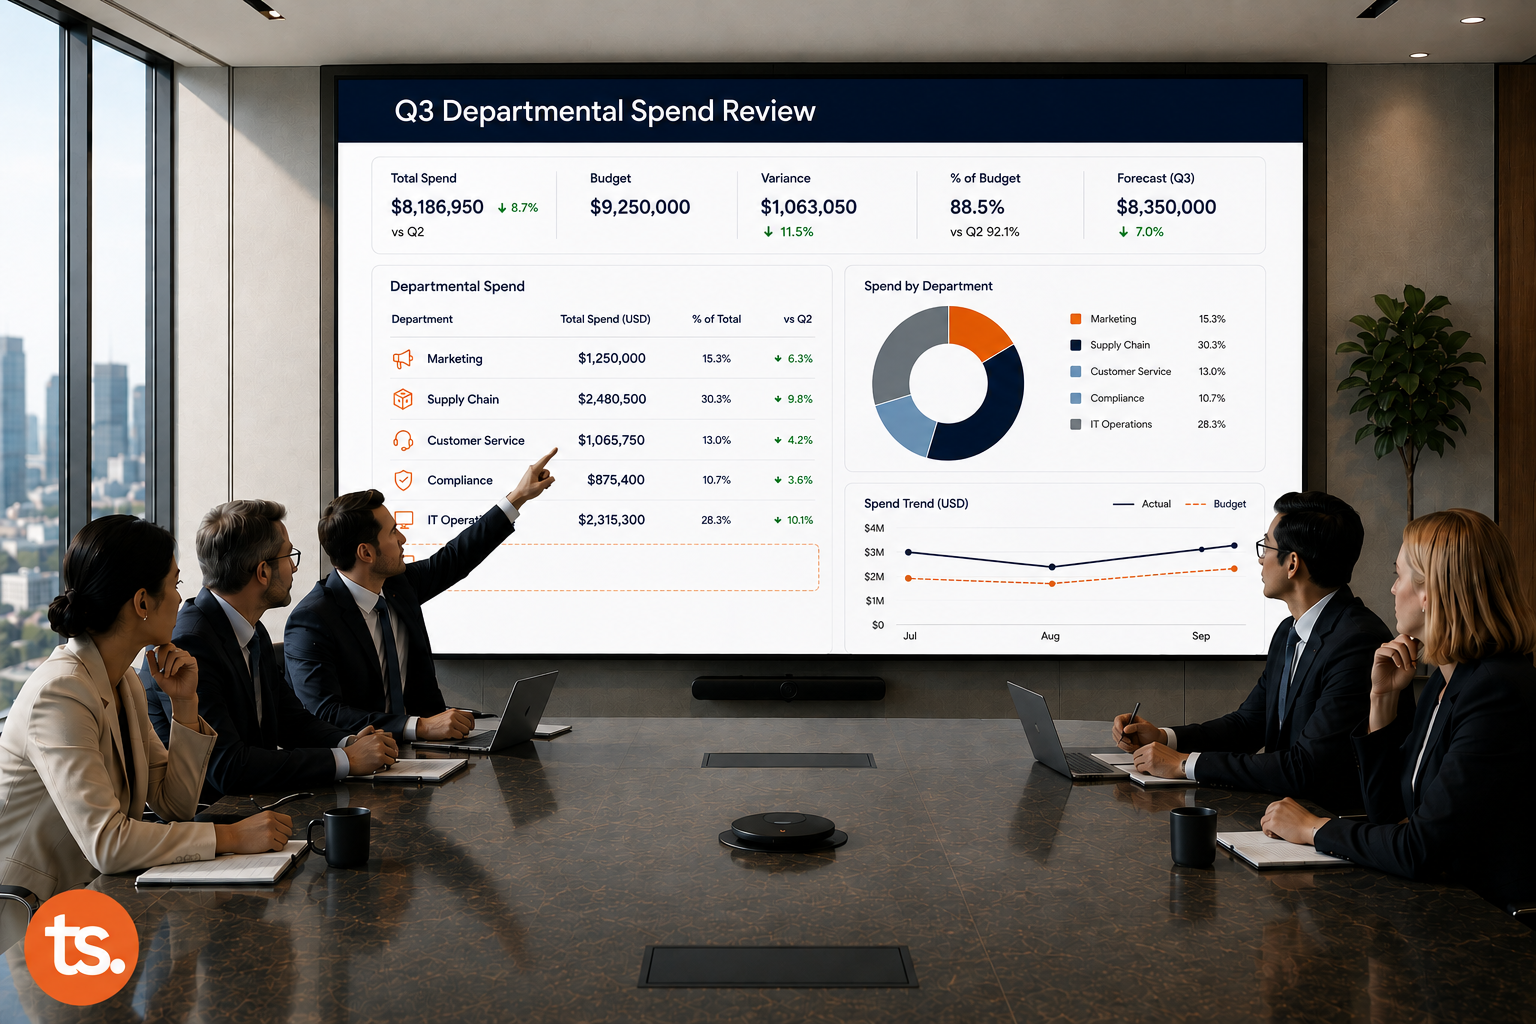
Every business exists to make money, and most executive rooms can tell you, without hesitation, that bad data is costing them some of it. What almost none of them can tell you is how much. The number was never built to be counted.
Picture a mid-size retailer that mismaps one attribute field during a catalog migration. Two thousand SKUs go live underpriced by an average of eleven percent. Nobody notices for six weeks. By the time finance flags the margin miss in a monthly review, merchandising is blaming the pricing team, the pricing team is blaming IT, and IT is investigating an integration issue that turns out to be one wrong field. The margin hit gets logged. The words "bad data" never appear on any document that describes it.
That is the actual shape of this cost, a hundred quiet failures rather than one dramatic one, each filed under someone else's name.
In brief
- The cost of bad data is widely felt and rarely priced, because it lives in several departments at once and no single role is responsible for adding the pieces together
- IBM's research confirms this pattern directly: 43% of chief operations officers now rank data quality as their top data priority, a sign the pain has reached far beyond data teams themselves
- PwC's 2026 research on CFO priorities finds finance leaders under growing pressure to prove returns on every investment, which is exactly why an unverifiable estimate stalls before it's understood
- The cost consistently splits into four categories, each tracked by a different team, which explains why it reads as several small problems rather than one large one
- Finance rarely rejects a data cost estimate because the problem isn't real. It rejects estimates it cannot verify against its own numbers
The cost of bad data, in this context, means the total financial impact of inaccurate, incomplete, or inconsistent data across an organization, including decision errors, automation failures, labor spent on reconciliation, and regulatory exposure, whether or not any single department has measured its own share of it.
What Bad Data Actually Costs, Beyond the Team That Notices It First
A sales team living with a bad lead list calls it a sales problem. Finance, dealing with a forecasting error six weeks later, calls it a modeling problem. Compliance, filing an audit finding, calls it a governance problem. Three teams, one shared cause, three different names for it.
IBM names four distinct types of consequence sitting underneath these labels: distorted decision-making, amplification through automation, erosion of trust among stakeholders, and compliance risk. Four teams, four symptoms, one root failure, told in four separate vocabularies.
IBM also found that 43% of chief operations officers now name data quality as their single most significant data priority. An operations leader, not a data specialist, saying this out loud is a signal worth taking seriously.
One Root Cause, Four Different Names
Return to the mismapped attribute. Monday, a leader signs off on a promotional pricing plan built from the same flawed catalog feed, unaware the underlying numbers are already wrong. Tuesday, an automated repricing system ingests the same feed and applies the error across every SKU it touches, not just the original two thousand. Wednesday, a data analyst notices two reports don't reconcile and spends the day manually cross-checking, hours nobody budgeted for. Friday, a routine compliance review flags an inconsistency in product attribute records, unrelated in the auditor's mind to anything from earlier that week.
One record. Four consequences. Five days. Almost nobody in that building will ever connect Monday to Friday.
Why the Same Failure Never Adds Up to One Number
Each department's reporting system tracks its own function well. None of them share a label for "this traces back to a data quality issue." So the connection has nowhere to live.
The margin miss from the pricing error shows up in a revenue report, filed as underperformance. The compliance finding shows up in an audit log, filed as a governance gap. Both documents are accurate. Neither one mentions the other. Read separately, each tells half a story, and the missing half is the part that would reveal the actual size of the problem.
This is not a hidden cost. Hidden costs sit somewhere waiting to be found. This cost is dispersed, spread across four places at once, and dispersal is harder to solve than concealment, because nobody's job is to look in four places simultaneously and add what they find.
The cost of bad data does not hide behind a single number. It exists between several small ones, none large enough on its own to justify action.
The Four-Category Framework for Pricing Bad Data
Naming the problem explains why it stays invisible. Pricing it requires four categories, translated into language a finance team already speaks.
"Why not just use an industry benchmark instead of building all this internally?" It's a fair question, and the honest answer is that a benchmark tells you what happened somewhere else, not what happened here. The four categories below exist precisely because "somewhere else" never survives a room full of people asking about this specific balance sheet.
What are the four categories where the cost of bad data actually shows up? Decision cost, propagation cost, reconciliation cost, and regulatory cost.
| Category | Where It Originates | Where a Finance Team Would Find It |
|---|---|---|
| Decision Cost | A strategic call made on a flawed dashboard or forecast | Missed revenue targets, mispriced offerings, misallocated budget |
| Propagation Cost | Bad data entering an automated or AI-driven system | The same error repeated across every output the system touches |
| Reconciliation Cost | Manual labor spent re-verifying data nobody trusts | Headcount hours logged against cleanup, folded into other tasks |
| Regulatory Cost | Weak governance exposing the organization to compliance risk | Fines, audit remediation, legal spend tied to data findings |
Decision Cost
The eleven-percent underpricing example is decision cost in its purest form. A leader trusted a dashboard. The dashboard was wrong. Six weeks passed before the trust was tested.
That gap, between the decision and the discovery, is why this category resists tracing. By the time the consequence surfaces, the flawed data has usually been overwritten. Someone has to want to find the original cause. Most people, holding a plausible explanation already, don't.
Propagation Cost
Bad data entering a human-reviewed process creates one mistake. Bad data entering an automated one creates a multiplier. The repricing system from Tuesday didn't repeat the original error once. It repeated it across every SKU it touched, at machine speed, before any person saw a single output.
This is the category growing fastest right now. AI adoption means more decisions route through systems built for speed, not for the pause a person occasionally takes to ask whether a number looks wrong.
Reconciliation Cost
Wednesday's analyst is the easiest character in this entire story to find inside a real organization. Someone, somewhere, is spending real hours right now reconciling two systems that disagree. That labor rarely gets logged as "data quality," and instead gets folded into general task time, disappearing into a spreadsheet nobody built to catch it. That invisibility is the opportunity here, not the obstacle, since the underlying hours already exist in a timesheet somewhere and simply haven't been tagged by cause.
Regulatory Cost
Friday's compliance flag lands as a line item in a legal budget, disconnected from the pricing error four days earlier that shares its root cause. The fine gets paid. The upstream gap that produced it stays open, and produces the next fine on a similar timeline.
How Finance Actually Evaluates a Data Cost Estimate
Everything above explains where the cost lives. It doesn't yet explain why a well-researched estimate still gets rejected in the room. This is the part most conversations about bad data skip, and it's the part that decides whether any of the previous four sections ever turn into a funded initiative.
Finance Rejects Numbers It Cannot Verify, Not Numbers It Doubts
A CFO who hears "bad data costs us millions" is not doubting the claim. Most already believe some version of it. What stops the request is simpler: the number arrives with no visible math behind it, and finance's job, structurally, is to interrogate math.
PwC's own research into 2026 CFO priorities describes finance leaders operating under exactly this pressure, expected to prove returns on every AI and digital investment they approve, while managing what PwC directly calls fragmented data and shrinking budgets. A number without a visible source doesn't just fail to persuade in that environment. It actively works against the person presenting it, since approving it would mean the CFO cannot in turn prove the return if challenged themselves.
An industry benchmark fails this test immediately, because it was never measured against this company's own systems. A labor-cost figure built from actual logged hours passes it, because finance can trace every dollar back to a timesheet it already trusts. This is why reconciliation cost, the least dramatic of the four categories, is consistently the one that survives a first budget review. It's the only category that arrives already speaking finance's native dialect: hours, rates, totals.
What Actually Clears a Budget Review
Three things separate a request that clears review from one that doesn't. A defensible floor, not a dramatic ceiling, since an inflated number invites the exact scrutiny that kills a request before it's understood. A named source for every figure, so a skeptical question has a direct answer rather than a shrug. And a scope small enough to audit in one sitting, which is why a single measured category beats a sweeping company-wide claim almost every time.
Capital allocation decisions inside most finance functions favor the request that's easiest to verify over the request that's largest in size. That single fact explains more about why data initiatives stall than any argument about the size of the underlying problem ever will.
Building the Ledger, Starting With One Category
Start smaller than a company-wide audit. Prove the method works once before asking anyone to trust it everywhere.
- Start with reconciliation cost. The data usually already exists in a timesheet or task tracker. The work here is retrieval, not collection.
- Tag existing entries by root cause. Go back through recent logs and mark which hours trace to a genuine data issue, not general friction.
- Convert the total into a dollar figure, using fully loaded labor cost, the exact unit finance already applies to every other line item.
- Repeat for the remaining three categories, one at a time. Attempting all four at once is how these efforts stall before producing anything usable.
The first category, once actually measured, is often large enough on its own to justify the initial request. The other three become the case for staying funded.
Six Questions That Reveal Whether This Cost Is Priced or Just Felt
[Visual: Self-Assessment Card — light-background checklist card, consistent with the established site format.]
Visibility and Ownership
- Could anyone in your organization name a single dollar figure for the total cost of bad data today?
- Is there one person accountable for consolidating that figure across departments, or does each team track its own piece?
- Would a data issue in one department ever get connected to a cost showing up in a completely different one?
Measurement and Language
- Do you track reconciliation hours, incident frequency, or resolution time by root cause?
- Would a figure presented to your CFO today already speak in finance's own terms, or need translation first?
- Is your current estimate, if one exists, a conservative floor or an inflated worst case?
Outcome guide: Three or more "no" answers means the cost currently exists as a felt pain, not a defensible figure. That's the exact condition that stalled the pricing team's funding request six weeks after the original error, and the exact condition most requests stall inside.
What to Bring Into the Room
The retailer from the opening never got the chance to prevent its pricing error. The next one can, but only with a repeatable way to build the ledger before the next mismapped field turns into six quiet weeks nobody can explain. That repeatability is the whole point. A single measured category proves the method works. A named owner, a finance-native vocabulary, and a conservative floor make it something a CFO can actually approve, and the four categories together give an organization a standing answer, not a one-time favor, the next time this question comes up.
That is exactly the capability ThoughtSpark's Data & AI Strategy and Data Readiness Hub practice is built to provide, for finance and data leaders who would rather walk into that next conversation with a number than a feeling.
Key Takeaways
- Only 43% of chief operations officers name data quality as their top priority, despite its cost touching nearly every function, per IBM
- PwC's 2026 CFO research finds finance leaders under mounting pressure to prove returns on every investment, which is exactly why unverifiable cost estimates rarely survive a budget review
- The cost splits into four measurable categories: decision cost, propagation cost, reconciliation cost, and regulatory cost
- Finance rejects estimates it cannot verify, not estimates it doubts, which is why labor-cost figures outperform industry benchmarks in a budget review
- A defensible number needs a named owner, finance's own vocabulary, and a conservative floor rather than a worst-case ceiling
- Reconciliation cost is the fastest category to measure, since the underlying hours usually already exist in a timesheet, just untagged